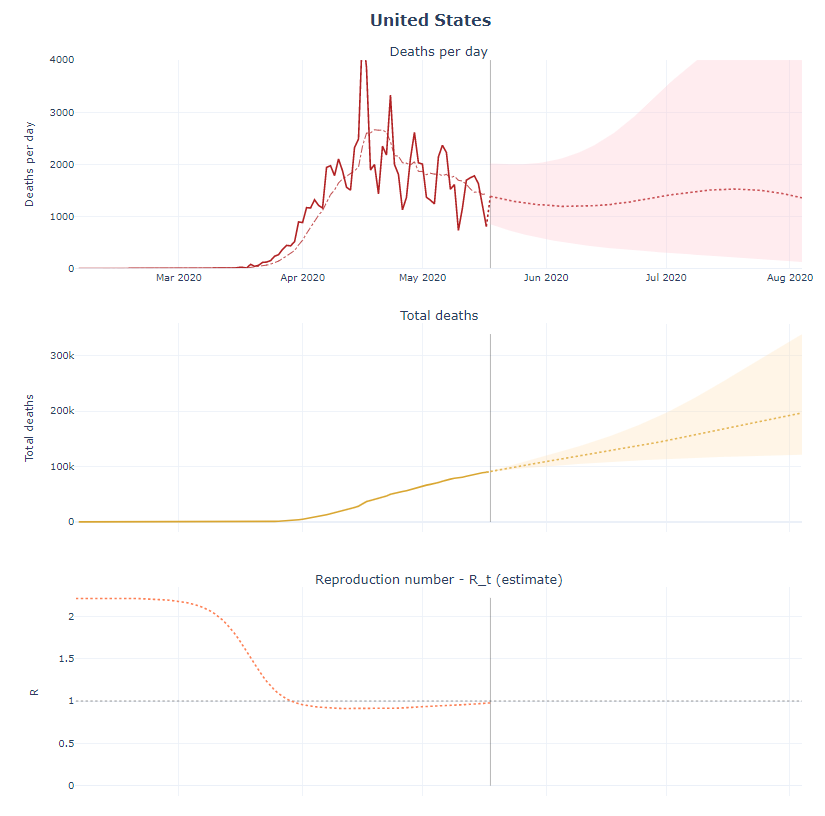
 The COVID-19 Projections web page contains daily updates of predictions for COVID-19. For example, the graphs copied here provide predictions for deaths per day, total deaths, and the reproduction number. Users can select projections for individual states and countries. The pages provide full model details which can be useful for any course that studies SIR models. In brief:
To quickly summarize how an SEIR model works, at each time period, an individual in a population is in one of four states: susceptible (S), exposed (E), infectious (I), and recovered (R). If an individual is in the susceptible state, we can assume they are healthy but have no immunity. If they are in the exposed state, they have been infected with the virus but are not infectious. If they are infectious, they can actively transmit the disease. An individual who is infected ultimately either recovers or dies. We assume that a recovered individual’s chances of re-infection is low, but not zero. We can model the movement of individuals through these various states at each time period. The model’s exact specifications depend on its parameters, which we describe in the next section.
The model details page includes clear statements on the fixed parameters and variable parameters, as well as how they are estimated. Along with the projections page there is an infections tracker page. Overall, there are numerous graphs, projections, and details about modeling.