The Pandemic’s Deadly Winter Surge Is Rapidly Easing
Cases are down 57 percent from the country’s all-time peak in early January, according to the COVID Tracking Project.
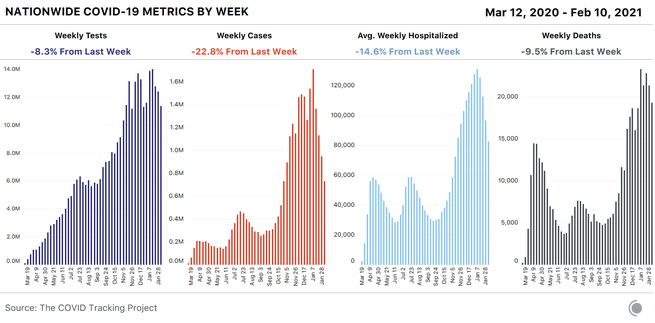
Nationally, all signs point to continued rapid easing of the pandemic’s deadly winter surge. Cases are down 23 percent from the previous week and down 57 percent from the country’s all-time peak in early January when the U.S. recorded 1.7 million new cases in a single week. Hospitalization numbers confirm this rapid decline: There are about 77,000 people hospitalized with COVID-19 in the U.S. as of February 10, down 42 percent from the country’s January 6 record of about 132,000 people. Reported deaths dropped for the second week in a row, with 19,266 deaths reported this week—almost 10 percent fewer than were reported in the previous week. (We have excluded from this count the 1,507 historical deaths Indiana reported with no corresponding dates on February 4; these deaths are included in our API and cumulative death count.) Testing dropped 8 percent this week, the third week of declines for that metric.
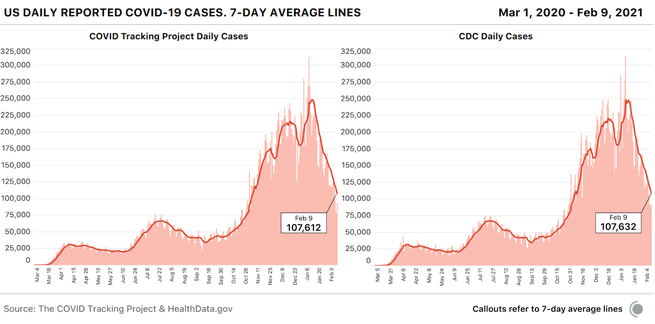
Data users planning to switch to federal data sources when our project ceases data compilation in March will be interested to note that the CDC’s case data match ours almost exactly: The two data sets are 0.018 percent apart on the seven-day average as of February 9.
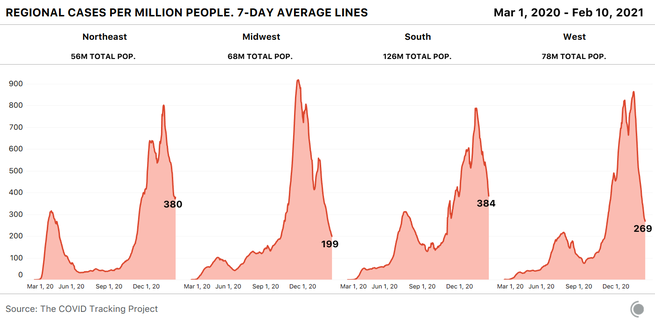
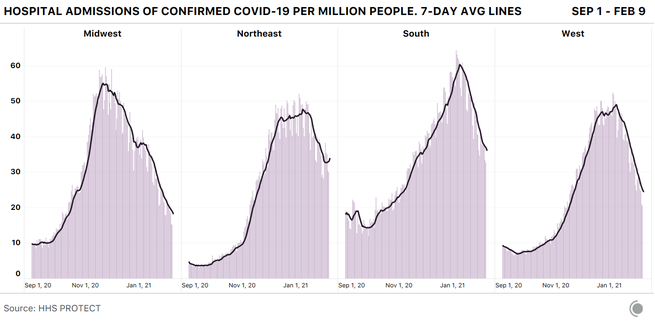
The national case decline is still reflected in a strong downward trajectory in three of the four U.S. census regions—but notably, the Northeast is no longer showing a case drop. We decided to look into that regional signal by investigating regional hospitalizations.
We often refer to current hospitalizations as a way of helping us understand the severity of COVID-19 outbreaks across the country, but it’s not the only useful hospital metric for this purpose. The current-hospitalizations metric measures the burden on hospitals effectively, but because it is affected by both new COVID-19 admissions and COVID-19 patients leaving the hospital, it’s not as good at revealing the direction of outbreaks. Particularly given that more transmissible variants of SARS-CoV-2 have been identified in much of the country, we’ve also been watching the new hospital-admissions data from the Department of Health and Human Services for early signals of directional change in outbreaks.
A per capita view of the new admissions data suggests that the Midwest, South, and West are all continuing to see new COVID-19 admissions decline, but the Northeast is now showing a small but noticeable increase in new admissions in the seven-day average. The little upward hook in the seven-day average of the Northeast’s hospital admissions chart looks surprisingly similar to the one we saw in regional cases. But where is it coming from?
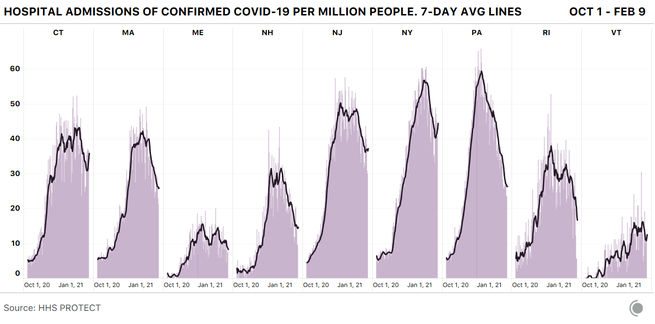
A state view shows where this admissions data might indicate a worsening situation: Connecticut and New York, especially, are showing notable increases in new admissions. But as we saw during the winter holidays, a confounding factor is in play for some metrics in the Northeast—not a holiday, this time, but the weather.
The nor’easter that affected much of the region from January 31 to February 3 appears to be visible in both case and test data as a drop followed by a recovery—and the storm very likely depressed hospital admissions as well, accounting for much of the matching upward tick we’re seeing in that metric in recent days.
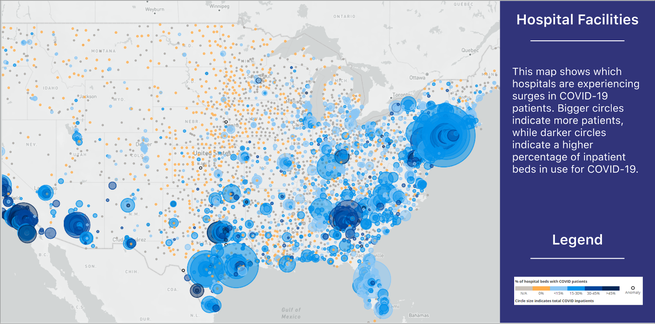
Still, the storm doesn’t explain other worrying indicators: New York currently has the highest per capita number of COVID-19 hospitalizations in the country, and the state’s hospitalizations aren’t falling as rapidly as they have in the recent hot-spot states of Arizona, California, and Georgia. And in a high-population state like New York, high per capita numbers translate into very high absolute counts. The facility-level hospitalization data from HHS provide an overview of COVID-19 hospitalizations across the U.S., including a look at the astonishing scale of hospitalizations in and near New York City.
Meanwhile, restaurants in New York State will be permitted to reopen indoor dining at 25 percent capacity beginning tomorrow.
We continue to watch every metric closely in the Northeast—and the rest of the country—and we caution data observers to take particular care when identifying short-term trends that may be explicable by non-pandemic factors.
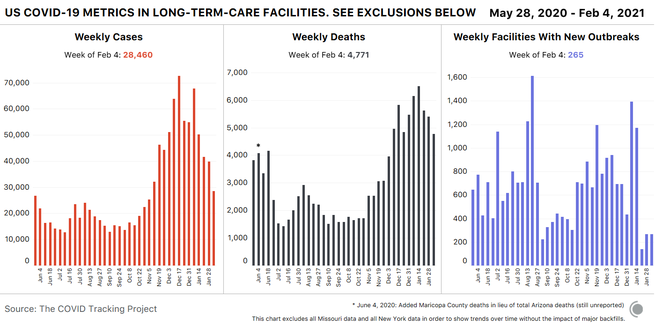
This week’s long-term-care chart excludes data from both Missouri and New York, both of which recently released very large cumulative additions to their data for long-term-care facilities without any corresponding historical time series, resulting in artificial spikes in our national data. The figures from these states are important, and remain in our data set, but when charted, they obscure trends from the rest of the country. Those trends are good: Nursing homes and other long-term-care facilities saw decreases in cases and deaths in our most recent week of data for these facilities, which runs from January 28 through February 4.
We wrote about Missouri’s release of cumulative historical data on cases and deaths associated with long-term-care facilities in last week’s update, and this week, we have even more confusing data from New York State. Throughout the pandemic, we’ve known that New York’s reported deaths from long-term-care-facility outbreaks were an undercount, because the state attributed deaths to long-term-care facilities only if patients actually died in the long-term-care facility. Any resident who contracted COVID-19 in an outbreak in a nursing home or assisted-living facility in New York and then died after being taken to a hospital, for example, was counted as a COVID-19 death in New York State, but not as a long-term-care-facility death.
On January 28, after New York Attorney General Letitia James called attention to New York’s undercount of deaths in nursing homes, state Health Commissioner Howard Zucker issued a statement that attributed to New York State nursing homes an additional 3,829 deaths that occurred as far back as March 1, 2020. In the two weeks since this statement, New York has added a total of 5,620 deaths associated with nursing homes and long-term-care facilities to its dashboard, nearly doubling the state’s cumulative count of deaths associated with these facilities.
New York has not provided any dates for these deaths, so we’re unable to backfill them into the correct weeks. Based on average reporting from the state in January, it is likely that up to about 600 of these deaths took place recently. This suggests that the state’s audit has to date revealed approximately 5,000 deaths associated with outbreaks in nursing homes and assisted-living facilities that the state had previously declined to attribute to those outbreaks.
Meanwhile, a peer-reviewed study of more than 13,000 U.S. nursing homes published this week in JAMA Network Open suggests that nursing homes with the highest proportions of nonwhite residents experienced COVID-19 death counts that were more than three times higher than those of facilities with the highest proportions of white residents.
The testing decline we’re now seeing is almost certainly due to a combination of reduced demand as well as reduced availability or accessibility of testing. Demand for testing may have dropped because fewer people are sick or have been exposed to infected individuals, but also perhaps because testing isn’t being promoted as heavily.
The resolution of holiday reporting backlogs also almost certainly produced an artificial spike in the number of tests reported in early January—which means the decline we’re seeing now looks particularly dramatic when measured against that postholiday spike.
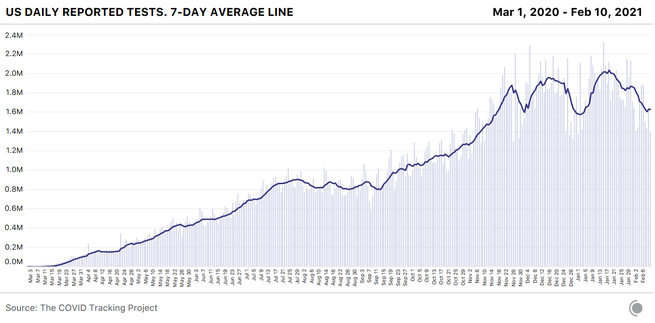
Even if we adjust for holiday effects and estimate that we’re really testing only 1 million fewer people each week than we did a month ago, that’s unequivocally the wrong direction for a country that needs to understand the movements of the virus during a slow vaccine rollout and the spread of multiple new variants.
According to public-health experts, we’re also still not doing enough testing, —and we weren’t doing enough even at the January testing peak. Back in October, the Harvard Global Health Institute and NPR released testing targets that set a national target of about 2 million PCR tests a day. If we discount holiday effects, the United States finally hit that target in the week ending January 20, when states reported about 14 million tests—though the number immediately began dropping. But the HGHI test targets were based on October 1 case counts, and even after weeks of declines, we’re seeing more than twice as many new cases a day now as in early October. Vaccinations are only one component of the effort to get the pandemic under control and prevent another devastating surge. We need to be testing at our full capacity—and increasing that capacity—to keep eyes on the pandemic as we move into spring.
Both testing and hospitalization data are crucially important COVID-19 metrics, helping us understand how the pandemic is changing and how to interpret other data we’re collecting. The race and ethnicity data for these metrics remain deeply inadequate in both state and federal data sources. Nearly a year into the U.S. pandemic, only 23 states report or have reported any data about the race and ethnicity of people hospitalized with COVID-19, and only nine states share data about the race and ethnicity of people who receive COVID-19 tests. As Marcella Nunez-Smith, the chair of the Biden-Harris COVID-19 Health Equity Task Force, said at a Kaiser Family Foundation briefing in December 2020, “There is violence in data invisibility. We cannot address what we cannot see. We are making a choice every time we allow poor-quality data to hinder our ability to intervene on racial and ethnic inequities.”
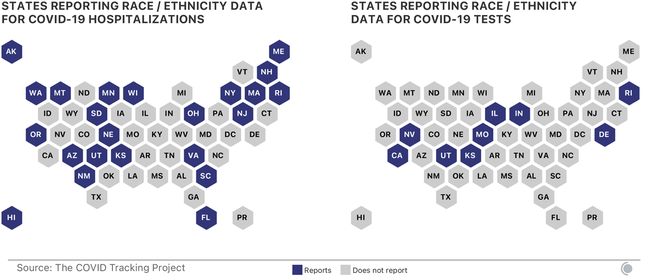
Although media and policy attention is increasingly focused on the lack of demographic data for vaccinations—data on race and ethnicity are missing for about half of all first doses administered in the first month of the U.S. vaccine rollout, according to a CDC report—demographic data for other COVID-19 metrics remain essential for identifying inequities in either impact or response. Without good, public demographic data on hospitalizations and tests, there can be no accountability for efforts to identify and address inequities. States and the federal government should work together to ensure that hospitals and testing providers are collecting sufficient demographic data, and that these data are rapidly and publicly shared.
The Atlantic’s COVID-19 coverage is supported by grants from the Chan Zuckerberg Initiative and the Robert Wood Johnson Foundation.