
How have things changed under Hugo Chávez, who died yesterday?
By looking at key indicators we can see that poverty levels and illiteracy have fallen but violent crime and inflation has increased.
Using data gathered from sources such as the World Bank, the United Nations High Commission for Refugees (UNHCR), International Monetary Fund (IMF), Reuters, the United Nations Office on Drugs and Crime (UNODC), the US Energy Information Administration (eia), the Organization of the Petroleum Exporting Countries (Opec) and the Instituto Nacional de Estadística, we have been able to gather a variety of key indicators that show how Venezuela has changed since 1999 when Chávez first assumed office. We've used the most recent data where possible.
Click on the above graphic to see a full size version. You can explore our interactive version of the key figures too. So what does the data show?
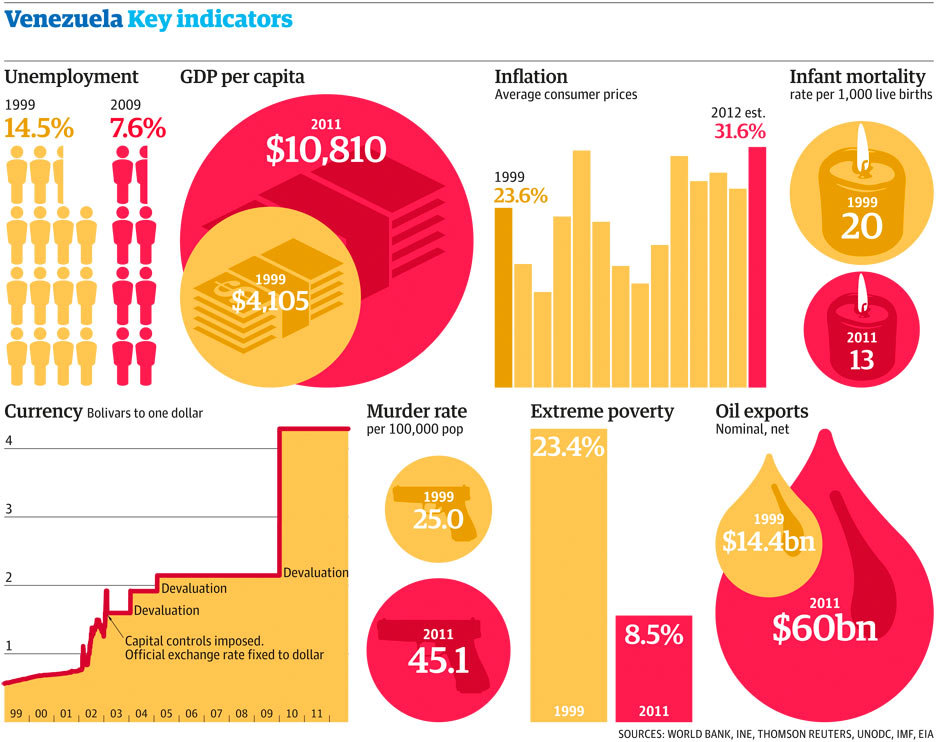
• Unemployment has dropped from 14.5% of the total labour force in 1999 to 7.6% in 2009
• Population has increased from 23,867,000 in 1999 to 29,278,000 in 2011. The annual population growth was 1.5% in 2011 compared with 1.9% in 1999
• GDP per capita has risen from $4,105 to $10,801 in 2011
• As you can see in the graphic chart, Venezuela's inflation has fluctuated since 1999. Inflation now stands at 31.6% compared with 23.6% in 1999
• Venezuela has a complicated history concerning currency exchange rates. Compared with 1999 when the exchange rate was under one bolivar to the US dollar, the latest figures from Reuters place it at 4.3 Bolivars to one dollar
• Poverty has decreased - in 1999, 23.4% of the population were recorded as being in extreme poverty, this fell to 8.5% in 2011 according to official government figures
• Infant mortality is now lower than in 1999 - from a rate of 20 per 1,000 live births then to a rate of 13 per 1,000 live births in 2011
• Violence has been a key concern in Venezuela for some time - figures from the UNODC state that the murder rate has risen since 1999. In 2011 the intentional homicide rate per 100,000 population was 45.1 compared with 25.0 just twelve years earlier
• Oil exports have boomed - Venezuela has one of the top proven oil reserves in the world and in 2011 Opec put the country's net oil export revenues at $60bn. In 1999 it stood at $14.4bn
The table below shows some of the key indicators used in the graphic and in this post. The downloadable spreadsheet has the full data behind the currency exchange and inflation charts as well as all the numbers seen here. What can you do with this data?
Data summary
Download the data
• DATA: download the full spreadsheet
NEW! Buy our book
• Facts are Sacred: the power of data (on Kindle)
More open data
Data journalism and data visualisations from the Guardian
World government data
• Search the world's government data with our gateway
Development and aid data
• Search the world's global development data with our gateway
Can you do something with this data?
• Flickr Please post your visualisations and mash-ups on our Flickr group
• Contact us at data@guardian.co.uk
• Get the A-Z of data
• More at the Datastore directory
• Follow us on Twitter
• Like us on Facebook
