Nashville-Davidson, Tennessee Submit your own pictures of this city and show them to the world
OSM Map
General Map
Google Map
MSN Map
OSM Map
General Map
Google Map
MSN Map
OSM Map
General Map
Google Map
MSN Map
OSM Map
General Map
Google Map
MSN Map
Please wait while loading the map...
Population in 2022: 683,622 (97% urban, 3% rural). Population change since 2000: +25.3%Males: 330,797 Females: 352,825
Zip codes: 37013 , 37080 , 37143 , 37189 , 37201 , 37203 , 37206 , 37207 , 37208 , 37209 , 37210 , 37212 , 37213 , 37214 , 37216 , 37217 , 37218 , 37219 , 37220 , 37221 , 37228 , 37240 , 37243, 37246.
Nashville-Davidson Zip Code Map March 2022 cost of living index in Nashville-Davidson: 91.3 (less than average, U.S. average is 100) Percentage of residents living in poverty in 2022: 14.1%for White Non-Hispanic residents , 21.8% for Black residents , 23.9% for Hispanic or Latino residents , 10.2% for American Indian residents , 48.0% for Native Hawaiian and other Pacific Islander residents , 23.6% for other race residents , 22.0% for two or more races residents )
Profiles of local businesses
Business Search - 14 Million verified businesses
Data:
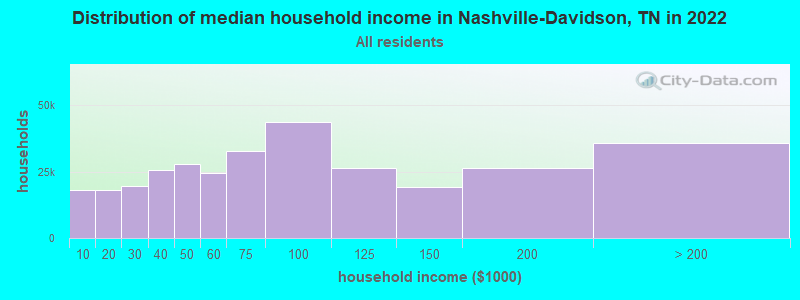
Median household income ($)
Median household income (% change since 2000)
Household income diversity
Ratio of average income to average house value (%)
Ratio of average income to average rent
Median household income ($) - White
Median household income ($) - Black or African American
Median household income ($) - Asian
Median household income ($) - Hispanic or Latino
Median household income ($) - American Indian and Alaska Native
Median household income ($) - Multirace
Median household income ($) - Other Race
Median household income for houses/condos with a mortgage ($)
Median household income for apartments without a mortgage ($)
Races - White alone (%)
Races - White alone (% change since 2000)
Races - Black alone (%)
Races - Black alone (% change since 2000)
Races - American Indian alone (%)
Races - American Indian alone (% change since 2000)
Races - Asian alone (%)
Races - Asian alone (% change since 2000)
Races - Hispanic (%)
Races - Hispanic (% change since 2000)
Races - Native Hawaiian and Other Pacific Islander alone (%)
Races - Native Hawaiian and Other Pacific Islander alone (% change since 2000)
Races - Two or more races (%)
Races - Two or more races (% change since 2000)
Races - Other race alone (%)
Races - Other race alone (% change since 2000)
Racial diversity
Unemployment (%)
Unemployment (% change since 2000)
Unemployment (%) - White
Unemployment (%) - Black or African American
Unemployment (%) - Asian
Unemployment (%) - Hispanic or Latino
Unemployment (%) - American Indian and Alaska Native
Unemployment (%) - Multirace
Unemployment (%) - Other Race
Population density (people per square mile)
Population - Males (%)
Population - Females (%)
Population - Males (%) - White
Population - Males (%) - Black or African American
Population - Males (%) - Asian
Population - Males (%) - Hispanic or Latino
Population - Males (%) - American Indian and Alaska Native
Population - Males (%) - Multirace
Population - Males (%) - Other Race
Population - Females (%) - White
Population - Females (%) - Black or African American
Population - Females (%) - Asian
Population - Females (%) - Hispanic or Latino
Population - Females (%) - American Indian and Alaska Native
Population - Females (%) - Multirace
Population - Females (%) - Other Race
Coronavirus confirmed cases (Apr 23, 2024)
Deaths caused by coronavirus (Apr 23, 2024)
Coronavirus confirmed cases (per 100k population) (Apr 23, 2024)
Deaths caused by coronavirus (per 100k population) (Apr 23, 2024)
Daily increase in number of cases (Apr 23, 2024)
Weekly increase in number of cases (Apr 23, 2024)
Cases doubled (in days) (Apr 23, 2024)
Hospitalized patients (Apr 18, 2022)
Negative test results (Apr 18, 2022)
Total test results (Apr 18, 2022)
COVID Vaccine doses distributed (per 100k population) (Sep 19, 2023)
COVID Vaccine doses administered (per 100k population) (Sep 19, 2023)
COVID Vaccine doses distributed (Sep 19, 2023)
COVID Vaccine doses administered (Sep 19, 2023)
Likely homosexual households (%)
Likely homosexual households (% change since 2000)
Likely homosexual households - Lesbian couples (%)
Likely homosexual households - Lesbian couples (% change since 2000)
Likely homosexual households - Gay men (%)
Likely homosexual households - Gay men (% change since 2000)
Cost of living index
Median gross rent ($)
Median contract rent ($)
Median monthly housing costs ($)
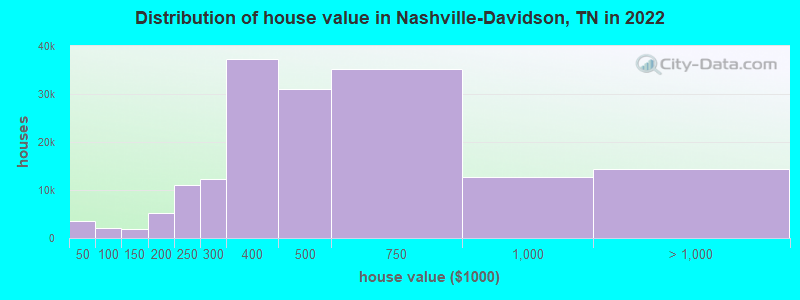
Median house or condo value ($)
Median house or condo value ($ change since 2000)
Mean house or condo value by units in structure - 1, detached ($)
Mean house or condo value by units in structure - 1, attached ($)
Mean house or condo value by units in structure - 2 ($)
Mean house or condo value by units in structure by units in structure - 3 or 4 ($)
Mean house or condo value by units in structure - 5 or more ($)
Mean house or condo value by units in structure - Boat, RV, van, etc. ($)
Mean house or condo value by units in structure - Mobile home ($)
Median house or condo value ($) - White
Median house or condo value ($) - Black or African American
Median house or condo value ($) - Asian
Median house or condo value ($) - Hispanic or Latino
Median house or condo value ($) - American Indian and Alaska Native
Median house or condo value ($) - Multirace
Median house or condo value ($) - Other Race
Median resident age
Resident age diversity
Median resident age - Males
Median resident age - Females
Median resident age - White
Median resident age - Black or African American
Median resident age - Asian
Median resident age - Hispanic or Latino
Median resident age - American Indian and Alaska Native
Median resident age - Multirace
Median resident age - Other Race
Median resident age - Males - White
Median resident age - Males - Black or African American
Median resident age - Males - Asian
Median resident age - Males - Hispanic or Latino
Median resident age - Males - American Indian and Alaska Native
Median resident age - Males - Multirace
Median resident age - Males - Other Race
Median resident age - Females - White
Median resident age - Females - Black or African American
Median resident age - Females - Asian
Median resident age - Females - Hispanic or Latino
Median resident age - Females - American Indian and Alaska Native
Median resident age - Females - Multirace
Median resident age - Females - Other Race
Commute - mean travel time to work (minutes)
Travel time to work - Less than 5 minutes (%)
Travel time to work - Less than 5 minutes (% change since 2000)
Travel time to work - 5 to 9 minutes (%)
Travel time to work - 5 to 9 minutes (% change since 2000)
Travel time to work - 10 to 19 minutes (%)
Travel time to work - 10 to 19 minutes (% change since 2000)
Travel time to work - 20 to 29 minutes (%)
Travel time to work - 20 to 29 minutes (% change since 2000)
Travel time to work - 30 to 39 minutes (%)
Travel time to work - 30 to 39 minutes (% change since 2000)
Travel time to work - 40 to 59 minutes (%)
Travel time to work - 40 to 59 minutes (% change since 2000)
Travel time to work - 60 to 89 minutes (%)
Travel time to work - 60 to 89 minutes (% change since 2000)
Travel time to work - 90 or more minutes (%)
Travel time to work - 90 or more minutes (% change since 2000)
Marital status - Never married (%)
Marital status - Now married (%)
Marital status - Separated (%)
Marital status - Widowed (%)
Marital status - Divorced (%)
Median family income ($)
Median family income (% change since 2000)
Median non-family income ($)
Median non-family income (% change since 2000)
Median per capita income ($)
Median per capita income (% change since 2000)
Median family income ($) - White
Median family income ($) - Black or African American
Median family income ($) - Asian
Median family income ($) - Hispanic or Latino
Median family income ($) - American Indian and Alaska Native
Median family income ($) - Multirace
Median family income ($) - Other Race
Median year house/condo built
Median year apartment built
Year house built - Built 2005 or later (%)
Year house built - Built 2000 to 2004 (%)
Year house built - Built 1990 to 1999 (%)
Year house built - Built 1980 to 1989 (%)
Year house built - Built 1970 to 1979 (%)
Year house built - Built 1960 to 1969 (%)
Year house built - Built 1950 to 1959 (%)
Year house built - Built 1940 to 1949 (%)
Year house built - Built 1939 or earlier (%)
Average household size
Household density (households per square mile)
Average household size - White
Average household size - Black or African American
Average household size - Asian
Average household size - Hispanic or Latino
Average household size - American Indian and Alaska Native
Average household size - Multirace
Average household size - Other Race
Occupied housing units (%)
Vacant housing units (%)
Owner occupied housing units (%)
Renter occupied housing units (%)
Vacancy status - For rent (%)
Vacancy status - For sale only (%)
Vacancy status - Rented or sold, not occupied (%)
Vacancy status - For seasonal, recreational, or occasional use (%)
Vacancy status - For migrant workers (%)
Vacancy status - Other vacant (%)
Residents with income below the poverty level (%)
Residents with income below 50% of the poverty level (%)
Children below poverty level (%)
Poor families by family type - Married-couple family (%)
Poor families by family type - Male, no wife present (%)
Poor families by family type - Female, no husband present (%)
Poverty status for native-born residents (%)
Poverty status for foreign-born residents (%)
Poverty among high school graduates not in families (%)
Poverty among people who did not graduate high school not in families (%)
Residents with income below the poverty level (%) - White
Residents with income below the poverty level (%) - Black or African American
Residents with income below the poverty level (%) - Asian
Residents with income below the poverty level (%) - Hispanic or Latino
Residents with income below the poverty level (%) - American Indian and Alaska Native
Residents with income below the poverty level (%) - Multirace
Residents with income below the poverty level (%) - Other Race
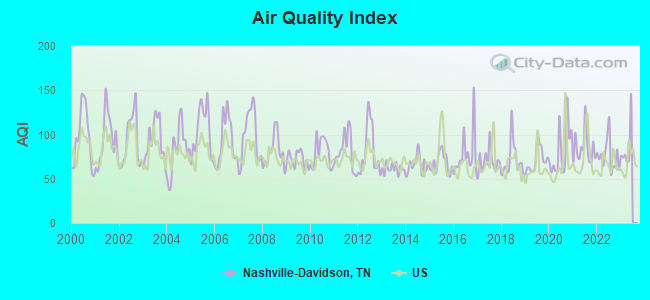
Air pollution - Air Quality Index (AQI)
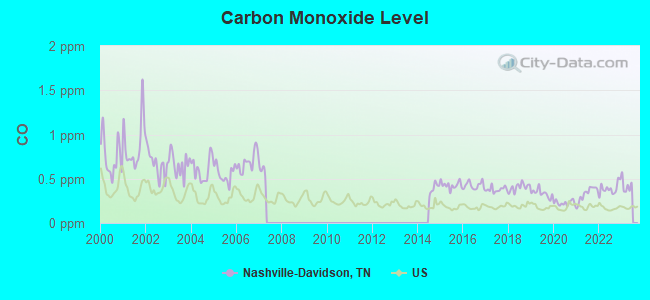
Air pollution - CO
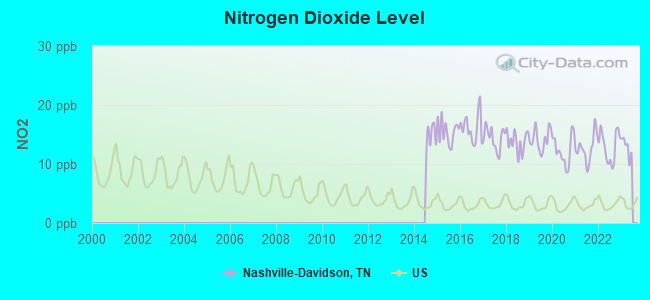
Air pollution - NO2
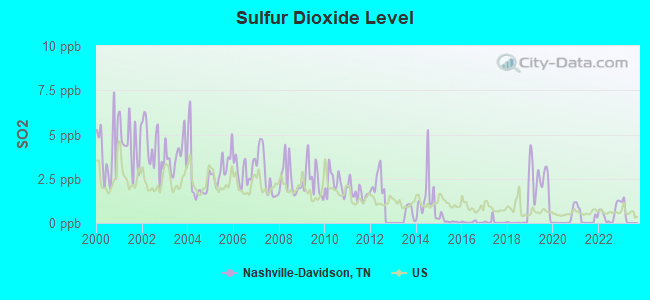
Air pollution - SO2
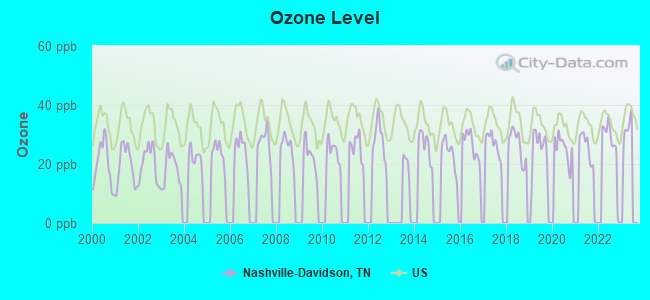
Air pollution - Ozone
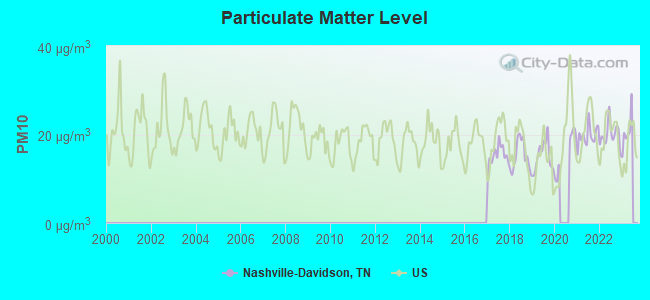
Air pollution - PM10
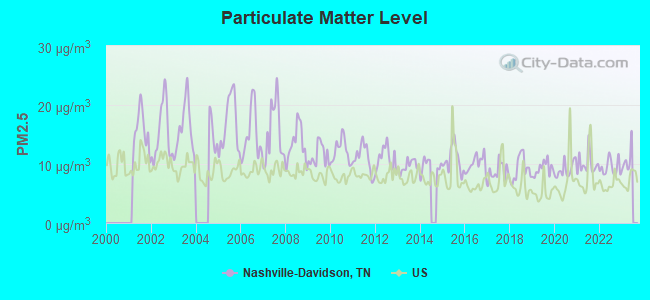
Air pollution - PM25
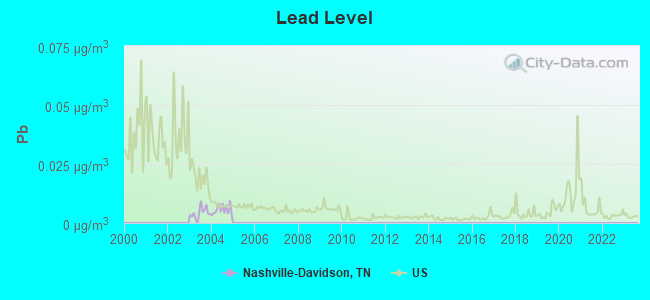
Air pollution - Pb
Crime - Murders per 100,000 population
Crime - Rapes per 100,000 population
Crime - Robberies per 100,000 population
Crime - Assaults per 100,000 population
Crime - Burglaries per 100,000 population
Crime - Thefts per 100,000 population
Crime - Auto thefts per 100,000 population
Crime - Arson per 100,000 population
Crime - City-data.com crime index
Crime - Violent crime index
Crime - Property crime index
Crime - Murders per 100,000 population (5 year average)
Crime - Rapes per 100,000 population (5 year average)
Crime - Robberies per 100,000 population (5 year average)
Crime - Assaults per 100,000 population (5 year average)
Crime - Burglaries per 100,000 population (5 year average)
Crime - Thefts per 100,000 population (5 year average)
Crime - Auto thefts per 100,000 population (5 year average)
Crime - Arson per 100,000 population (5 year average)
Crime - City-data.com crime index (5 year average)
Crime - Violent crime index (5 year average)
Crime - Property crime index (5 year average)
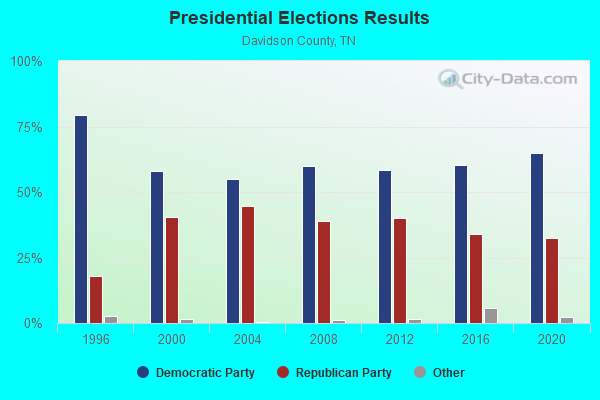
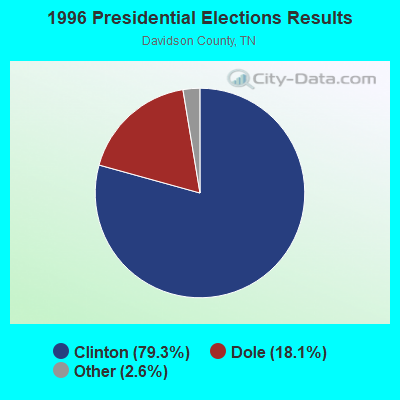
1996 Presidential Elections Results (%) - Democratic Party (Clinton)
1996 Presidential Elections Results (%) - Republican Party (Dole)
1996 Presidential Elections Results (%) - Other
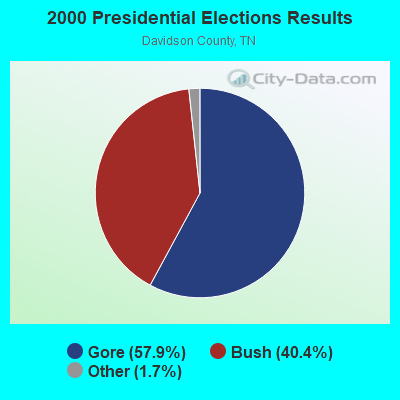
2000 Presidential Elections Results (%) - Democratic Party (Gore)
2000 Presidential Elections Results (%) - Republican Party (Bush)
2000 Presidential Elections Results (%) - Other
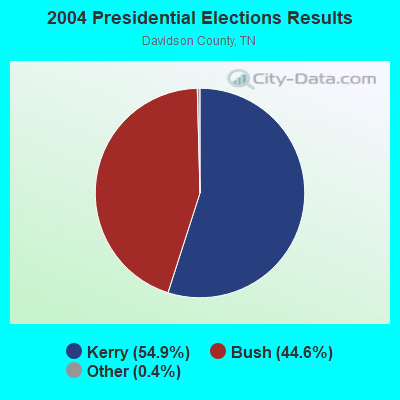
2004 Presidential Elections Results (%) - Democratic Party (Kerry)
2004 Presidential Elections Results (%) - Republican Party (Bush)
2004 Presidential Elections Results (%) - Other
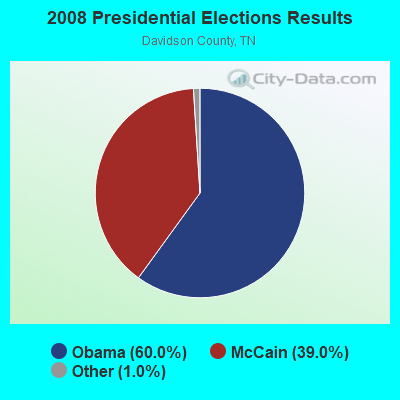
2008 Presidential Elections Results (%) - Democratic Party (Obama)
2008 Presidential Elections Results (%) - Republican Party (McCain)
2008 Presidential Elections Results (%) - Other
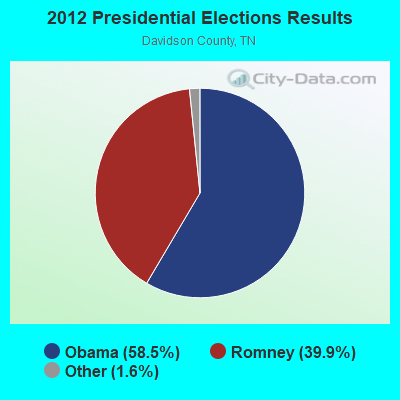
2012 Presidential Elections Results (%) - Democratic Party (Obama)
2012 Presidential Elections Results (%) - Republican Party (Romney)
2012 Presidential Elections Results (%) - Other
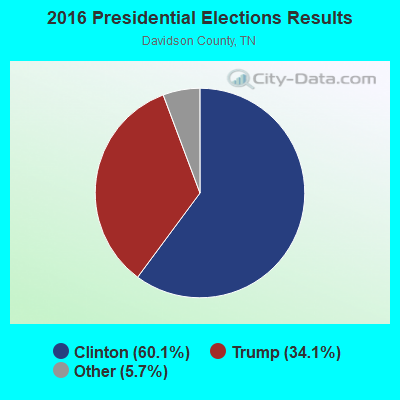
2016 Presidential Elections Results (%) - Democratic Party (Clinton)
2016 Presidential Elections Results (%) - Republican Party (Trump)
2016 Presidential Elections Results (%) - Other
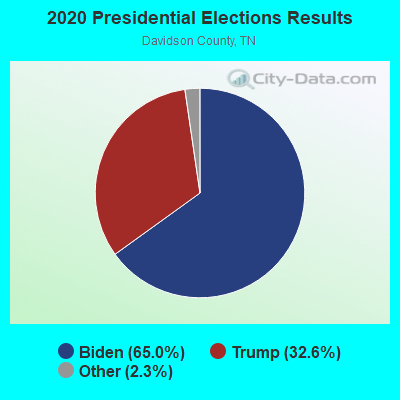
2020 Presidential Elections Results (%) - Democratic Party (Biden)
2020 Presidential Elections Results (%) - Republican Party (Trump)
2020 Presidential Elections Results (%) - Other
Ancestries Reported - Arab (%)
Ancestries Reported - Czech (%)
Ancestries Reported - Danish (%)
Ancestries Reported - Dutch (%)
Ancestries Reported - English (%)
Ancestries Reported - French (%)
Ancestries Reported - French Canadian (%)
Ancestries Reported - German (%)
Ancestries Reported - Greek (%)
Ancestries Reported - Hungarian (%)
Ancestries Reported - Irish (%)
Ancestries Reported - Italian (%)
Ancestries Reported - Lithuanian (%)
Ancestries Reported - Norwegian (%)
Ancestries Reported - Polish (%)
Ancestries Reported - Portuguese (%)
Ancestries Reported - Russian (%)
Ancestries Reported - Scotch-Irish (%)
Ancestries Reported - Scottish (%)
Ancestries Reported - Slovak (%)
Ancestries Reported - Subsaharan African (%)
Ancestries Reported - Swedish (%)
Ancestries Reported - Swiss (%)
Ancestries Reported - Ukrainian (%)
Ancestries Reported - United States (%)
Ancestries Reported - Welsh (%)
Ancestries Reported - West Indian (%)
Ancestries Reported - Other (%)
Educational Attainment - No schooling completed (%)
Educational Attainment - Less than high school (%)
Educational Attainment - High school or equivalent (%)
Educational Attainment - Less than 1 year of college (%)
Educational Attainment - 1 or more years of college (%)
Educational Attainment - Associate degree (%)
Educational Attainment - Bachelor's degree (%)
Educational Attainment - Master's degree (%)
Educational Attainment - Professional school degree (%)
Educational Attainment - Doctorate degree (%)
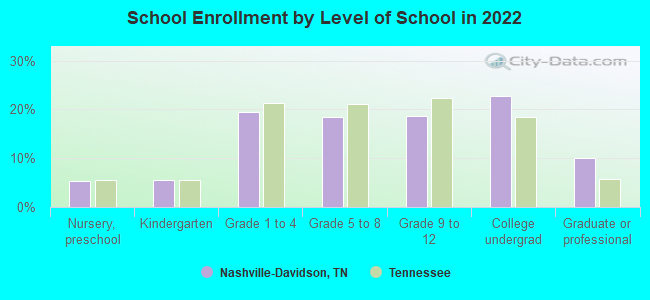
School Enrollment - Nursery, preschool (%)
School Enrollment - Kindergarten (%)
School Enrollment - Grade 1 to 4 (%)
School Enrollment - Grade 5 to 8 (%)
School Enrollment - Grade 9 to 12 (%)
School Enrollment - College undergrad (%)
School Enrollment - Graduate or professional (%)
School Enrollment - Not enrolled in school (%)
School enrollment - Public schools (%)
School enrollment - Private schools (%)
School enrollment - Not enrolled (%)
Median number of rooms in houses and condos
Median number of rooms in apartments
Housing units lacking complete plumbing facilities (%)
Housing units lacking complete kitchen facilities (%)
Density of houses
Urban houses (%)
Rural houses (%)
Households with people 60 years and over (%)
Households with people 65 years and over (%)
Households with people 75 years and over (%)
Households with one or more nonrelatives (%)
Households with no nonrelatives (%)
Population in households (%)
Family households (%)
Nonfamily households (%)
Population in families (%)
Family households with own children (%)
Median number of bedrooms in owner occupied houses
Mean number of bedrooms in owner occupied houses
Median number of bedrooms in renter occupied houses
Mean number of bedrooms in renter occupied houses
Median number of vehichles in owner occupied houses
Mean number of vehichles in owner occupied houses
Median number of vehichles in renter occupied houses
Mean number of vehichles in renter occupied houses
Mortgage status - with mortgage (%)
Mortgage status - with second mortgage (%)
Mortgage status - with home equity loan (%)
Mortgage status - with both second mortgage and home equity loan (%)
Mortgage status - without a mortgage (%)
Average family size
Average family size - White
Average family size - Black or African American
Average family size - Asian
Average family size - Hispanic or Latino
Average family size - American Indian and Alaska Native
Average family size - Multirace
Average family size - Other Race
Geographical mobility - Same house 1 year ago (%)
Geographical mobility - Moved within same county (%)
Geographical mobility - Moved from different county within same state (%)
Geographical mobility - Moved from different state (%)
Geographical mobility - Moved from abroad (%)
Place of birth - Born in state of residence (%)
Place of birth - Born in other state (%)
Place of birth - Native, outside of US (%)
Place of birth - Foreign born (%)
Housing units in structures - 1, detached (%)
Housing units in structures - 1, attached (%)
Housing units in structures - 2 (%)
Housing units in structures - 3 or 4 (%)
Housing units in structures - 5 to 9 (%)
Housing units in structures - 10 to 19 (%)
Housing units in structures - 20 to 49 (%)
Housing units in structures - 50 or more (%)
Housing units in structures - Mobile home (%)
Housing units in structures - Boat, RV, van, etc. (%)
House/condo owner moved in on average (years ago)
Renter moved in on average (years ago)
Year householder moved into unit - Moved in 1999 to March 2000 (%)
Year householder moved into unit - Moved in 1995 to 1998 (%)
Year householder moved into unit - Moved in 1990 to 1994 (%)
Year householder moved into unit - Moved in 1980 to 1989 (%)
Year householder moved into unit - Moved in 1970 to 1979 (%)
Year householder moved into unit - Moved in 1969 or earlier (%)
Means of transportation to work - Drove car alone (%)
Means of transportation to work - Carpooled (%)
Means of transportation to work - Public transportation (%)
Means of transportation to work - Bus or trolley bus (%)
Means of transportation to work - Streetcar or trolley car (%)
Means of transportation to work - Subway or elevated (%)
Means of transportation to work - Railroad (%)
Means of transportation to work - Ferryboat (%)
Means of transportation to work - Taxicab (%)
Means of transportation to work - Motorcycle (%)
Means of transportation to work - Bicycle (%)
Means of transportation to work - Walked (%)
Means of transportation to work - Other means (%)
Working at home (%)
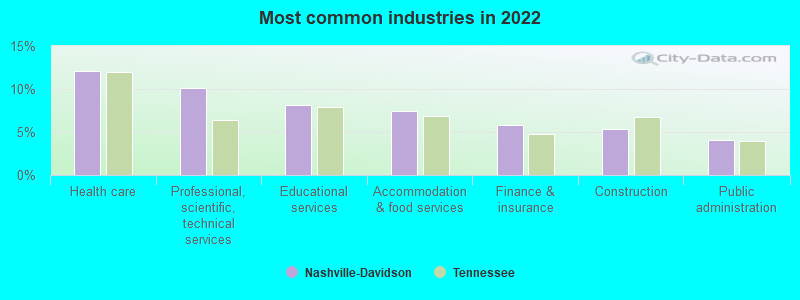
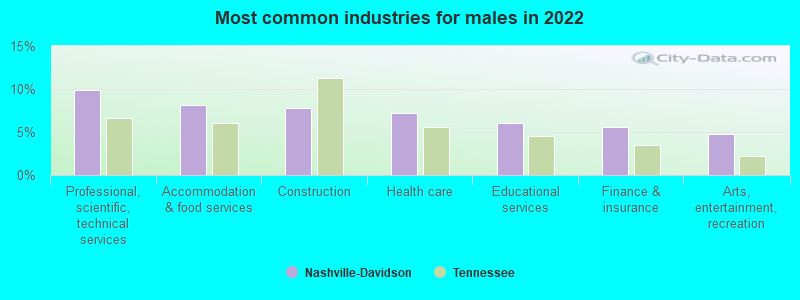
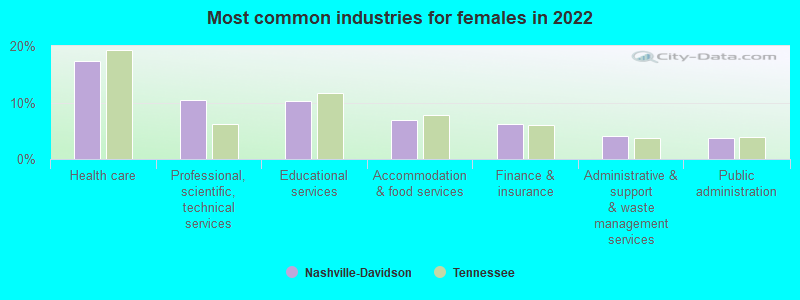
Industry diversity
Most Common Industries - Agriculture, forestry, fishing and hunting, and mining (%)
Most Common Industries - Agriculture, forestry, fishing and hunting (%)
Most Common Industries - Mining, quarrying, and oil and gas extraction (%)
Most Common Industries - Construction (%)
Most Common Industries - Manufacturing (%)
Most Common Industries - Wholesale trade (%)
Most Common Industries - Retail trade (%)
Most Common Industries - Transportation and warehousing, and utilities (%)
Most Common Industries - Transportation and warehousing (%)
Most Common Industries - Utilities (%)
Most Common Industries - Information (%)
Most Common Industries - Finance and insurance, and real estate and rental and leasing (%)
Most Common Industries - Finance and insurance (%)
Most Common Industries - Real estate and rental and leasing (%)
Most Common Industries - Professional, scientific, and management, and administrative and waste management services (%)
Most Common Industries - Professional, scientific, and technical services (%)
Most Common Industries - Management of companies and enterprises (%)
Most Common Industries - Administrative and support and waste management services (%)
Most Common Industries - Educational services, and health care and social assistance (%)
Most Common Industries - Educational services (%)
Most Common Industries - Health care and social assistance (%)
Most Common Industries - Arts, entertainment, and recreation, and accommodation and food services (%)
Most Common Industries - Arts, entertainment, and recreation (%)
Most Common Industries - Accommodation and food services (%)
Most Common Industries - Other services, except public administration (%)
Most Common Industries - Public administration (%)
Occupation diversity
Most Common Occupations - Management, business, science, and arts occupations (%)
Most Common Occupations - Management, business, and financial occupations (%)
Most Common Occupations - Management occupations (%)
Most Common Occupations - Business and financial operations occupations (%)
Most Common Occupations - Computer, engineering, and science occupations (%)
Most Common Occupations - Computer and mathematical occupations (%)
Most Common Occupations - Architecture and engineering occupations (%)
Most Common Occupations - Life, physical, and social science occupations (%)
Most Common Occupations - Education, legal, community service, arts, and media occupations (%)
Most Common Occupations - Community and social service occupations (%)
Most Common Occupations - Legal occupations (%)
Most Common Occupations - Education, training, and library occupations (%)
Most Common Occupations - Arts, design, entertainment, sports, and media occupations (%)
Most Common Occupations - Healthcare practitioners and technical occupations (%)
Most Common Occupations - Health diagnosing and treating practitioners and other technical occupations (%)
Most Common Occupations - Health technologists and technicians (%)
Most Common Occupations - Service occupations (%)
Most Common Occupations - Healthcare support occupations (%)
Most Common Occupations - Protective service occupations (%)
Most Common Occupations - Fire fighting and prevention, and other protective service workers including supervisors (%)
Most Common Occupations - Law enforcement workers including supervisors (%)
Most Common Occupations - Food preparation and serving related occupations (%)
Most Common Occupations - Building and grounds cleaning and maintenance occupations (%)
Most Common Occupations - Personal care and service occupations (%)
Most Common Occupations - Sales and office occupations (%)
Most Common Occupations - Sales and related occupations (%)
Most Common Occupations - Office and administrative support occupations (%)
Most Common Occupations - Natural resources, construction, and maintenance occupations (%)
Most Common Occupations - Farming, fishing, and forestry occupations (%)
Most Common Occupations - Construction and extraction occupations (%)
Most Common Occupations - Installation, maintenance, and repair occupations (%)
Most Common Occupations - Production, transportation, and material moving occupations (%)
Most Common Occupations - Production occupations (%)
Most Common Occupations - Transportation occupations (%)
Most Common Occupations - Material moving occupations (%)
People in Group quarters - Institutionalized population (%)
People in Group quarters - Correctional institutions (%)
People in Group quarters - Federal prisons and detention centers (%)
People in Group quarters - Halfway houses (%)
People in Group quarters - Local jails and other confinement facilities (including police lockups) (%)
People in Group quarters - Military disciplinary barracks (%)
People in Group quarters - State prisons (%)
People in Group quarters - Other types of correctional institutions (%)
People in Group quarters - Nursing homes (%)
People in Group quarters - Hospitals/wards, hospices, and schools for the handicapped (%)
People in Group quarters - Hospitals/wards and hospices for chronically ill (%)
People in Group quarters - Hospices or homes for chronically ill (%)
People in Group quarters - Military hospitals or wards for chronically ill (%)
People in Group quarters - Other hospitals or wards for chronically ill (%)
People in Group quarters - Hospitals or wards for drug/alcohol abuse (%)
People in Group quarters - Mental (Psychiatric) hospitals or wards (%)
People in Group quarters - Schools, hospitals, or wards for the mentally retarded (%)
People in Group quarters - Schools, hospitals, or wards for the physically handicapped (%)
People in Group quarters - Institutions for the deaf (%)
People in Group quarters - Institutions for the blind (%)
People in Group quarters - Orthopedic wards and institutions for the physically handicapped (%)
People in Group quarters - Wards in general hospitals for patients who have no usual home elsewhere (%)
People in Group quarters - Wards in military hospitals for patients who have no usual home elsewhere (%)
People in Group quarters - Juvenile institutions (%)
People in Group quarters - Long-term care (%)
People in Group quarters - Homes for abused, dependent, and neglected children (%)
People in Group quarters - Residential treatment centers for emotionally disturbed children (%)
People in Group quarters - Training schools for juvenile delinquents (%)
People in Group quarters - Short-term care, detention or diagnostic centers for delinquent children (%)
People in Group quarters - Type of juvenile institution unknown (%)
People in Group quarters - Noninstitutionalized population (%)
People in Group quarters - College dormitories (includes college quarters off campus) (%)
People in Group quarters - Military quarters (%)
People in Group quarters - On base (%)
People in Group quarters - Barracks, unaccompanied personnel housing (UPH), (Enlisted/Officer), ;and similar group living quarters for military personnel (%)
People in Group quarters - Transient quarters for temporary residents (%)
People in Group quarters - Military ships (%)
People in Group quarters - Group homes (%)
People in Group quarters - Homes or halfway houses for drug/alcohol abuse (%)
People in Group quarters - Homes for the mentally ill (%)
People in Group quarters - Homes for the mentally retarded (%)
People in Group quarters - Homes for the physically handicapped (%)
People in Group quarters - Other group homes (%)
People in Group quarters - Religious group quarters (%)
People in Group quarters - Dormitories (%)
People in Group quarters - Agriculture workers' dormitories on farms (%)
People in Group quarters - Job Corps and vocational training facilities (%)
People in Group quarters - Other workers' dormitories (%)
People in Group quarters - Crews of maritime vessels (%)
People in Group quarters - Other nonhousehold living situations (%)
People in Group quarters - Other noninstitutional group quarters (%)
Residents speaking English at home (%)
Residents speaking English at home - Born in the United States (%)
Residents speaking English at home - Native, born elsewhere (%)
Residents speaking English at home - Foreign born (%)
Residents speaking Spanish at home (%)
Residents speaking Spanish at home - Born in the United States (%)
Residents speaking Spanish at home - Native, born elsewhere (%)
Residents speaking Spanish at home - Foreign born (%)
Residents speaking other language at home (%)
Residents speaking other language at home - Born in the United States (%)
Residents speaking other language at home - Native, born elsewhere (%)
Residents speaking other language at home - Foreign born (%)
Class of Workers - Employee of private company (%)
Class of Workers - Self-employed in own incorporated business (%)
Class of Workers - Private not-for-profit wage and salary workers (%)
Class of Workers - Local government workers (%)
Class of Workers - State government workers (%)
Class of Workers - Federal government workers (%)
Class of Workers - Self-employed workers in own not incorporated business and Unpaid family workers (%)
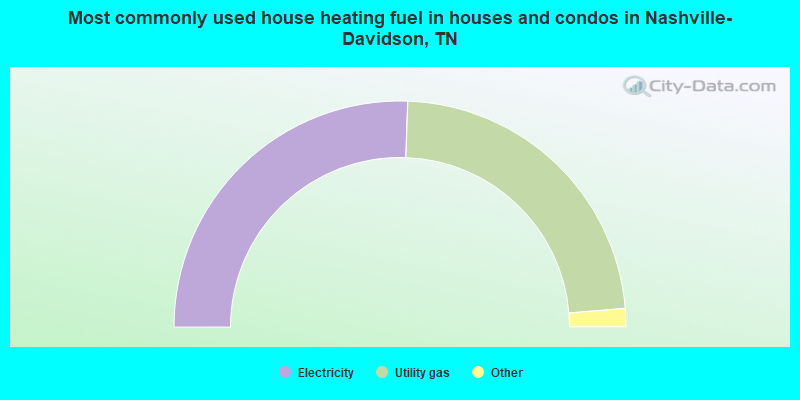
House heating fuel used in houses and condos - Utility gas (%)
House heating fuel used in houses and condos - Bottled, tank, or LP gas (%)
House heating fuel used in houses and condos - Electricity (%)
House heating fuel used in houses and condos - Fuel oil, kerosene, etc. (%)
House heating fuel used in houses and condos - Coal or coke (%)
House heating fuel used in houses and condos - Wood (%)
House heating fuel used in houses and condos - Solar energy (%)
House heating fuel used in houses and condos - Other fuel (%)
House heating fuel used in houses and condos - No fuel used (%)
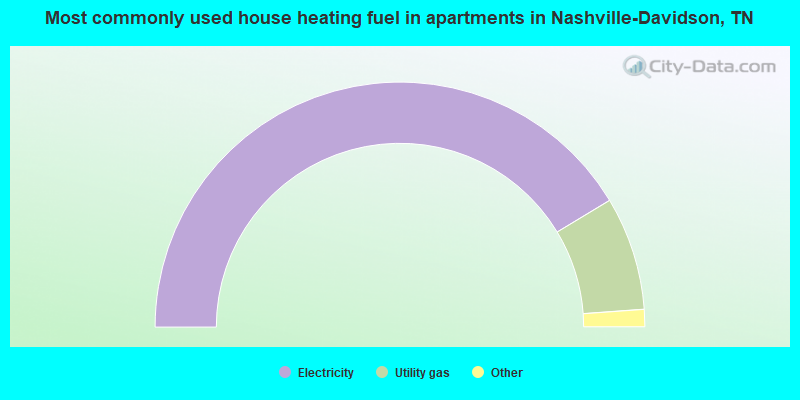
House heating fuel used in apartments - Utility gas (%)
House heating fuel used in apartments - Bottled, tank, or LP gas (%)
House heating fuel used in apartments - Electricity (%)
House heating fuel used in apartments - Fuel oil, kerosene, etc. (%)
House heating fuel used in apartments - Coal or coke (%)
House heating fuel used in apartments - Wood (%)
House heating fuel used in apartments - Solar energy (%)
House heating fuel used in apartments - Other fuel (%)
House heating fuel used in apartments - No fuel used (%)
Armed forces status - In Armed Forces (%)
Armed forces status - Civilian (%)
Armed forces status - Civilian - Veteran (%)
Armed forces status - Civilian - Nonveteran (%)
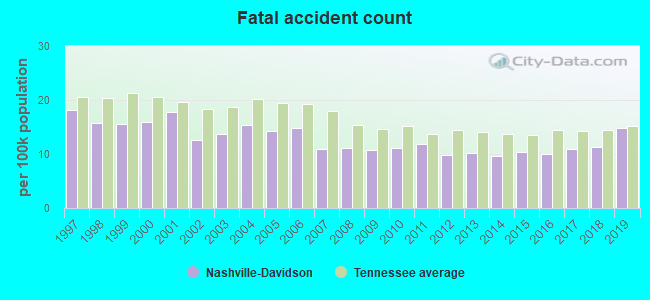
Fatal accidents locations in years 2005-2021
Fatal accidents locations in 2005
Fatal accidents locations in 2006
Fatal accidents locations in 2007
Fatal accidents locations in 2008
Fatal accidents locations in 2009
Fatal accidents locations in 2010
Fatal accidents locations in 2011
Fatal accidents locations in 2012
Fatal accidents locations in 2013
Fatal accidents locations in 2014
Fatal accidents locations in 2015
Fatal accidents locations in 2016
Fatal accidents locations in 2017
Fatal accidents locations in 2018
Fatal accidents locations in 2019
Fatal accidents locations in 2020
Fatal accidents locations in 2021
Alcohol use - People drinking some alcohol every month (%)
Alcohol use - People not drinking at all (%)
Alcohol use - Average days/month drinking alcohol
Alcohol use - Average drinks/week
Alcohol use - Average days/year people drink much
Audiometry - Average condition of hearing (%)
Audiometry - People that can hear a whisper from across a quiet room (%)
Audiometry - People that can hear normal voice from across a quiet room (%)
Audiometry - Ears ringing, roaring, buzzing (%)
Audiometry - Had a job exposure to loud noise (%)
Audiometry - Had off-work exposure to loud noise (%)
Blood Pressure & Cholesterol - Has high blood pressure (%)
Blood Pressure & Cholesterol - Checking blood pressure at home (%)
Blood Pressure & Cholesterol - Frequently checking blood cholesterol (%)
Blood Pressure & Cholesterol - Has high cholesterol level (%)
Consumer Behavior - Money monthly spent on food at supermarket/grocery store
Consumer Behavior - Money monthly spent on food at other stores
Consumer Behavior - Money monthly spent on eating out
Consumer Behavior - Money monthly spent on carryout/delivered foods
Consumer Behavior - Income spent on food at supermarket/grocery store (%)
Consumer Behavior - Income spent on food at other stores (%)
Consumer Behavior - Income spent on eating out (%)
Consumer Behavior - Income spent on carryout/delivered foods (%)
Current Health Status - General health condition (%)
Current Health Status - Blood donors (%)
Current Health Status - Has blood ever tested for HIV virus (%)
Current Health Status - Left-handed people (%)
Dermatology - People using sunscreen (%)
Diabetes - Diabetics (%)
Diabetes - Had a blood test for high blood sugar (%)
Diabetes - People taking insulin (%)
Diet Behavior & Nutrition - Diet health (%)
Diet Behavior & Nutrition - Milk product consumption (# of products/month)
Diet Behavior & Nutrition - Meals not home prepared (#/week)
Diet Behavior & Nutrition - Meals from fast food or pizza place (#/week)
Diet Behavior & Nutrition - Ready-to-eat foods (#/month)
Diet Behavior & Nutrition - Frozen meals/pizza (#/month)
Drug Use - People that ever used marijuana or hashish (%)
Drug Use - Ever used hard drugs (%)
Drug Use - Ever used any form of cocaine (%)
Drug Use - Ever used heroin (%)
Drug Use - Ever used methamphetamine (%)
Health Insurance - People covered by health insurance (%)
Kidney Conditions-Urology - Avg. # of times urinating at night
Medical Conditions - People with asthma (%)
Medical Conditions - People with anemia (%)
Medical Conditions - People with psoriasis (%)
Medical Conditions - People with overweight (%)
Medical Conditions - Elderly people having difficulties in thinking or remembering (%)
Medical Conditions - People who ever received blood transfusion (%)
Medical Conditions - People having trouble seeing even with glass/contacts (%)
Medical Conditions - People with arthritis (%)
Medical Conditions - People with gout (%)
Medical Conditions - People with congestive heart failure (%)
Medical Conditions - People with coronary heart disease (%)
Medical Conditions - People with angina pectoris (%)
Medical Conditions - People who ever had heart attack (%)
Medical Conditions - People who ever had stroke (%)
Medical Conditions - People with emphysema (%)
Medical Conditions - People with thyroid problem (%)
Medical Conditions - People with chronic bronchitis (%)
Medical Conditions - People with any liver condition (%)
Medical Conditions - People who ever had cancer or malignancy (%)
Mental Health - People who have little interest in doing things (%)
Mental Health - People feeling down, depressed, or hopeless (%)
Mental Health - People who have trouble sleeping or sleeping too much (%)
Mental Health - People feeling tired or having little energy (%)
Mental Health - People with poor appetite or overeating (%)
Mental Health - People feeling bad about themself (%)
Mental Health - People who have trouble concentrating on things (%)
Mental Health - People moving or speaking slowly or too fast (%)
Mental Health - People having thoughts they would be better off dead (%)
Oral Health - Average years since last visit a dentist
Oral Health - People embarrassed because of mouth (%)
Oral Health - People with gum disease (%)
Oral Health - General health of teeth and gums (%)
Oral Health - Average days a week using dental floss/device
Oral Health - Average days a week using mouthwash for dental problem
Oral Health - Average number of teeth
Pesticide Use - Households using pesticides to control insects (%)
Pesticide Use - Households using pesticides to kill weeds (%)
Physical Activity - People doing vigorous-intensity work activities (%)
Physical Activity - People doing moderate-intensity work activities (%)
Physical Activity - People walking or bicycling (%)
Physical Activity - People doing vigorous-intensity recreational activities (%)
Physical Activity - People doing moderate-intensity recreational activities (%)
Physical Activity - Average hours a day doing sedentary activities
Physical Activity - Average hours a day watching TV or videos
Physical Activity - Average hours a day using computer
Physical Functioning - People having limitations keeping them from working (%)
Physical Functioning - People limited in amount of work they can do (%)
Physical Functioning - People that need special equipment to walk (%)
Physical Functioning - People experiencing confusion/memory problems (%)
Physical Functioning - People requiring special healthcare equipment (%)
Prescription Medications - Average number of prescription medicines taking
Preventive Aspirin Use - Adults 40+ taking low-dose aspirin (%)
Reproductive Health - Vaginal deliveries (%)
Reproductive Health - Cesarean deliveries (%)
Reproductive Health - Deliveries resulted in a live birth (%)
Reproductive Health - Pregnancies resulted in a delivery (%)
Reproductive Health - Women breastfeeding newborns (%)
Reproductive Health - Women that had a hysterectomy (%)
Reproductive Health - Women that had both ovaries removed (%)
Reproductive Health - Women that have ever taken birth control pills (%)
Reproductive Health - Women taking birth control pills (%)
Reproductive Health - Women that have ever used Depo-Provera or injectables (%)
Reproductive Health - Women that have ever used female hormones (%)
Sexual Behavior - People 18+ that ever had sex (vaginal, anal, or oral) (%)
Sexual Behavior - Males 18+ that ever had vaginal sex with a woman (%)
Sexual Behavior - Males 18+ that ever performed oral sex on a woman (%)
Sexual Behavior - Males 18+ that ever had anal sex with a woman (%)
Sexual Behavior - Males 18+ that ever had any sex with a man (%)
Sexual Behavior - Females 18+ that ever had vaginal sex with a man (%)
Sexual Behavior - Females 18+ that ever performed oral sex on a man (%)
Sexual Behavior - Females 18+ that ever had anal sex with a man (%)
Sexual Behavior - Females 18+ that ever had any kind of sex with a woman (%)
Sexual Behavior - Average age people first had sex
Sexual Behavior - Average number of female sex partners in lifetime (males 18+)
Sexual Behavior - Average number of female vaginal sex partners in lifetime (males 18+)
Sexual Behavior - Average age people first performed oral sex on a woman (18+)
Sexual Behavior - Average number of woman performed oral sex on in lifetime (18+)
Sexual Behavior - Average number of male sex partners in lifetime (males 18+)
Sexual Behavior - Average number of male anal sex partners in lifetime (males 18+)
Sexual Behavior - Average age people first performed oral sex on a man (18+)
Sexual Behavior - Average number of male oral sex partners in lifetime (18+)
Sexual Behavior - People using protection when performing oral sex (%)
Sexual Behavior - Average number of times people have vaginal or anal sex a year
Sexual Behavior - People having sex without condom (%)
Sexual Behavior - Average number of male sex partners in lifetime (females 18+)
Sexual Behavior - Average number of male vaginal sex partners in lifetime (females 18+)
Sexual Behavior - Average number of female sex partners in lifetime (females 18+)
Sexual Behavior - Circumcised males 18+ (%)
Sleep Disorders - Average hours sleeping at night
Sleep Disorders - People that has trouble sleeping (%)
Smoking-Cigarette Use - People smoking cigarettes (%)
Taste & Smell - People 40+ having problems with smell (%)
Taste & Smell - People 40+ having problems with taste (%)
Taste & Smell - People 40+ that ever had wisdom teeth removed (%)
Taste & Smell - People 40+ that ever had tonsils teeth removed (%)
Taste & Smell - People 40+ that ever had a loss of consciousness because of a head injury (%)
Taste & Smell - People 40+ that ever had a broken nose or other serious injury to face or skull (%)
Taste & Smell - People 40+ that ever had two or more sinus infections (%)
Weight - Average height (inches)
Weight - Average weight (pounds)
Weight - Average BMI
Weight - People that are obese (%)
Weight - People that ever were obese (%)
Weight - People trying to lose weight (%)
Ancestries: American (8.8%), English (7.2%), African (4.2%), Irish (4.1%), German (4.0%), European (2.7%).
Current Local Time:
Land area: 473.3 square miles.
Population density: 1,444 people per square mile (low).
97,863 residents are foreign born (5.6% Latin America , 3.9% Asia , 2.9% Africa ).
This city:
14.3%Tennessee:
5.4%
Median real estate property taxes paid for housing units with mortgages in 2022: $2,494 (0.6%)Median real estate property taxes paid for housing units with no mortgage in 2022: $2,422 (0.6%)
Nearest city with pop. 1,000,000+: Chicago, IL
Nearest cities:
Latitude: 36.15 N, Longitude: 86.76 W
Daytime population change due to commuting: +109,419 (+16.0%)Workers who live and work in this city: 319,175 (82.6%)
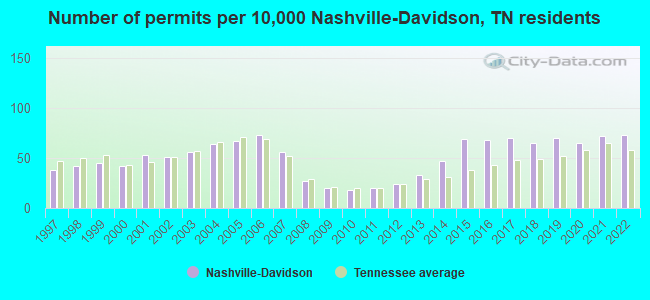
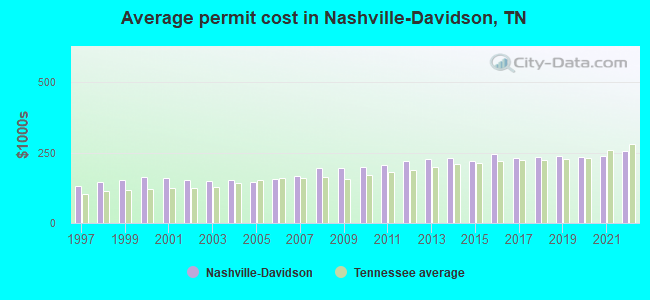
Single-family new house construction building permits:
2022: 3977 buildings , average cost: $256,2002021: 3932 buildings , average cost: $237,6002020: 3533 buildings , average cost: $234,3002019: 3830 buildings , average cost: $237,1002018: 3560 buildings , average cost: $235,1002017: 3827 buildings , average cost: $230,3002016: 3712 buildings , average cost: $243,5002015: 3738 buildings , average cost: $220,9002014: 2538 buildings , average cost: $229,7002013: 1824 buildings , average cost: $227,3002012: 1305 buildings , average cost: $219,5002011: 1078 buildings , average cost: $206,6002010: 1001 buildings , average cost: $198,3002009: 1068 buildings , average cost: $195,6002008: 1483 buildings , average cost: $196,1002007: 3070 buildings , average cost: $167,8002006: 3959 buildings , average cost: $157,2002005: 3681 buildings , average cost: $147,4002004: 3494 buildings , average cost: $152,1002003: 3080 buildings , average cost: $148,4002002: 2757 buildings , average cost: $151,8002001: 2869 buildings , average cost: $160,9002000: 2294 buildings , average cost: $163,0001999: 2435 buildings , average cost: $151,9001998: 2309 buildings , average cost: $144,3001997: 2059 buildings , average cost: $131,000Unemployment in December 2023: Population change in the 1990s: +56,950 (+11.7%).
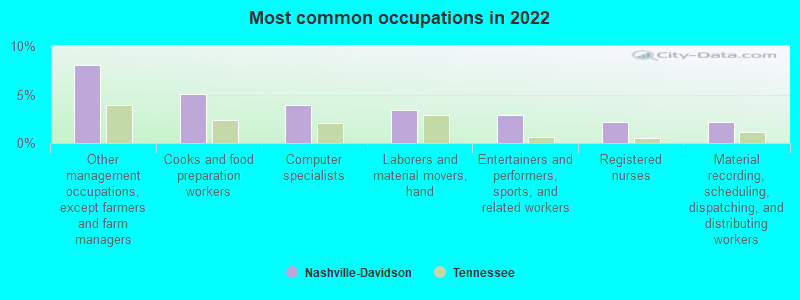
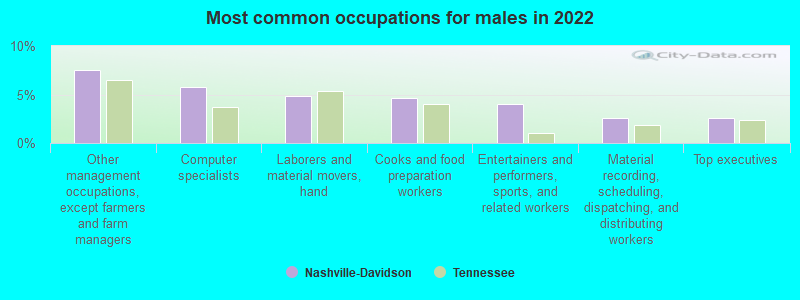
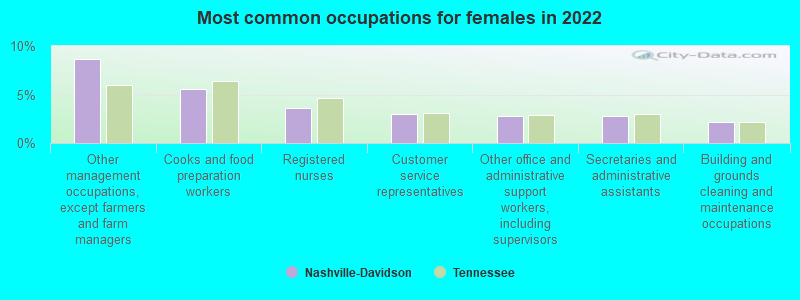
Most common occupations in Nashville-Davidson, TN (%)
Both Males Females
Other management occupations, except farmers and farm managers (8.1%)
Cooks and food preparation workers (5.1%)
Computer specialists (3.9%)
Laborers and material movers, hand (3.4%)
Entertainers and performers, sports, and related workers (2.9%)
Registered nurses (2.2%)
Material recording, scheduling, dispatching, and distributing workers (2.2%)
Other management occupations, except farmers and farm managers (7.6%)
Computer specialists (5.8%)
Laborers and material movers, hand (4.8%)
Cooks and food preparation workers (4.6%)
Entertainers and performers, sports, and related workers (4.0%)
Material recording, scheduling, dispatching, and distributing workers (2.6%)
Top executives (2.6%)
Other management occupations, except farmers and farm managers (8.6%)
Cooks and food preparation workers (5.6%)
Registered nurses (3.6%)
Customer service representatives (3.0%)
Other office and administrative support workers, including supervisors (2.8%)
Secretaries and administrative assistants (2.7%)
Building and grounds cleaning and maintenance occupations (2.1%)
Tornado activity:
Nashville-Davidson-area historical tornado activity is slightly above Tennessee state average. It is 69% greater than the overall U.S. average.
On 12/24/1988, a category F4 (max. wind speeds 207-260 mph) tornado 8.7 miles away from the Nashville-Davidson city center killed one person and injured 7 people and caused between $5,000,000 and $50,000,000 in damages.
On 4/16/1998, a category F5 (max. wind speeds 261-318 mph) tornado 42.5 miles away from the city center killed 3 people and injured 36 people and caused $13 million in damages.
Earthquake activity:
Nashville-Davidson-area historical earthquake activity is significantly above Tennessee state average. It is 196% greater than the overall U.S. average. On 4/18/2008 at 09:36:59, a magnitude 5.4 (5.1 MB, 4.8 MS, 5.4 MW, 5.2 MW, Class: Moderate, Intensity: VI - VII) earthquake occurred 170.5 miles away from the city center On 4/18/2008 at 09:36:59, a magnitude 5.2 (5.2 MW, Depth: 8.9 mi) earthquake occurred 170.5 miles away from Nashville-Davidson center On 6/18/2002 at 17:37:15, a magnitude 5.0 (4.3 MB, 4.6 MW, 5.0 LG) earthquake occurred 138.6 miles away from the city center On 4/29/2003 at 08:59:39, a magnitude 4.9 (4.4 MB, 4.6 MW, 4.9 LG, Class: Light, Intensity: IV - V) earthquake occurred 131.5 miles away from the city center On 9/26/1990 at 13:18:51, a magnitude 5.0 (4.7 MB, 4.8 LG, 5.0 LG, Depth: 7.7 mi) earthquake occurred 169.0 miles away from Nashville-Davidson center On 7/27/1980 at 18:52:21, a magnitude 5.2 (5.1 MB, 4.7 MS, 5.0 UK, 5.2 UK) earthquake occurred 210.3 miles away from Nashville-Davidson center Magnitude types: regional Lg-wave magnitude (LG), body-wave magnitude (MB), surface-wave magnitude (MS), moment magnitude (MW) Natural disasters: The number of natural disasters in Davidson County (17) is near the US average (15).Major Disasters (Presidential) Declared: 14Emergencies Declared: 1Floods: 12, Storms: 12, Tornadoes: 10, Winds: 4, Winter Storms: 2, Flash Flood: 1, Hurricane: 1, Ice Storm: 1, Other: 1 (Note: some incidents may be assigned to more than one category). Hospitals and medical centers near Nashville-Davidson: TREVECCA HEALTH CARE CENTER (Nursing Home, about 1 miles away; NASHVILLE, TN)
EAST VILLA NH (Nursing Home, about 2 miles away; NASHVILLE, TN)
LAKESHORE WEDGEWOOD (Nursing Home, about 2 miles away; NASHVILLE, TN)
DCI MEDICAL CENTER (Dialysis Facility, about 2 miles away; NASHVILLE, TN)
NASHVILLE HOME TRAINING DIALYSIS (Dialysis Facility, about 2 miles away; NASHVILLE, TN)
DCI HOME TRAINING OF MIDDLE TN (Dialysis Facility, about 2 miles away; NASHVILLE, TN)
ALIVE HOSPICE INC (Hospital, about 2 miles away; NASHVILLE, TN)
Amtrak station near Nashville-Davidson: 2 miles: NASHVILLE (GREYHOUND STA., 200 8TH AVE. S.) - Bus Station Services: enclosed waiting area, public restrooms, public payphones, intercity bus service.
Colleges/universities with over 2000 students nearest to Nashville-Davidson:
Trevecca Nazarene University (about 2 miles; Nashville, TN ; Full-time enrollment: 2,223)
Belmont University (about 3 miles; Nashville, TN ; FT enrollment: 5,795)
Vanderbilt University (about 3 miles; Nashville, TN ; FT enrollment: 10,518)
Tennessee State University (about 4 miles; Nashville, TN ; FT enrollment: 7,341)
Lipscomb University (about 5 miles; Nashville, TN ; FT enrollment: 3,827)
Nashville State Community College (about 6 miles; Nashville, TN ; FT enrollment: 6,436)
Volunteer State Community College (about 21 miles; Gallatin, TN ; FT enrollment: 5,311)
Biggest public high schools in Nashville-Davidson: MCGAVOCK HIGH Students: 3,126, Location: 3150 MCGAVOCK PK, Grades: 9-12)HUNTERS LANE HIGH Students: 2,219, Location: 1150 HUNTERS LA, Grades: 9-12)JOHN OVERTON HIGH Students: 1,819, Location: 4820 FRANKLIN RD, Grades: 9-12)GLENCLIFF HIGH SCHOOL Students: 1,750, Location: 160 ANTIOCH PK, Grades: 9-12)HILLWOOD HIGH Students: 1,737, Location: 400 DAVIDSON RD, Grades: 9-12)HILLSBORO HIGH Students: 1,408, Location: 3812 HILLSBORO RD, Grades: 9-12)STRATFORD HIGH Students: 1,362, Location: 1800 STRATFORD AV, Grades: 9-12)MAPLEWOOD HIGH Students: 1,189, Location: 401 WALTON LA, Grades: 9-12)MIDDLE COLLEGE HIGH Students: 881, Location: 120 WHITE BRIDGE RD, Grades: 10-12)NASHVILLE SCHOOL OF THE ARTS Students: 637, Location: 1250 FOSTER AV, Grades: 9-12)Biggest private high schools in Nashville-Davidson: DAVID LIPSCOMB CAMPUS SCHOOL Students: 1,321, Location: 3901 GRANNY WHITE PIKE, Grades: PK-12)
CHRIST PRESBYTERIAN ACADEMY Students: 1,181, Location: 2323A OLD HICKORY BLVD, Grades: PK-12)
THE ENSWORTH SCHOOL Students: 1,053, Location: 211 ENSWORTH PL, Grades: KG-12)
UNIVERSITY SCHOOL OF NASHVILLE Students: 1,034, Location: 2000 EDGEHILL AVE, Grades: KG-12)
FATHER RYAN HIGH SCHOOL Students: 933, Location: 700 NORWOOD DR, Grades: 9-12)
FRANKLIN ROAD ACADEMY Students: 817, Location: 4700 FRANKLIN PIKE, Grades: PK-12)
DONELSON CHRISTIAN ACADEMY Students: 782, Location: 300 DANYACREST DR, Grades: PK-12)
DAVIDSON ACADEMY Students: 726, Location: 1414 OLD HICKORY BLVD, Grades: PK-12)MONTGOMERY BELL ACADEMY Students: 715, Location: 4001 W END AVE, Grades: 7-12, Boys only )
HARPETH HALL SCHOOL Students: 664, Location: 3801 HOBBS RD, Grades: 5-12, Girls only )
Biggest public elementary/middle schools in Nashville-Davidson: WRIGHT MIDDLE Students: 1,040, Location: 180 MCCALL ST, Grades: 5-8)MCMURRAY MIDDLE Students: 869, Location: 520 MCMURRAY DR, Grades: 5-8)DONELSON MIDDLE Students: 847, Location: 110 STEWARTS FERRY PK, Grades: 5-8)UNA ELEMENTARY Students: 842, Location: 2018 MURFREESBORO RD, Grades: PK-4)GRA-MAR MIDDLE Students: 798, Location: 575 JOYCE LA, Grades: 5-8)HARPETH VALLEY ELEMENTARY Students: 769, Location: 7840 LEARNING LA, Grades: PK-4)HAYWOOD ELEMENTARY Students: 747, Location: 3790 TURLEY DR, Grades: PK-4)COCKRILL ELEMENTARY Students: 727, Location: 4701 INDIANA AV, Grades: PK-4)JERE BAXTER MIDDLE Students: 705, Location: 350 HART LA, Grades: 5-8)LAKEVIEW ELEMENTARY Students: 690, Location: 455 RURAL HILL RD, Grades: PK-4)Biggest private elementary/middle schools in Nashville-Davidson: THE OAK HILL SCHOOL Students: 514, Location: 4815 FRANKLIN PIKE, Grades: PK-6)HARDING ACADEMY Students: 482, Location: 170 WINDSOR DR, Grades: KG-8)ST EDWARD ELEMENTARY SCHOOL Students: 434, Location: 190 THOMPSON LN, Grades: PK-8)
HOLY ROSARY ACADEMY Students: 394, Location: 190 GRAYLYNN DR, Grades: PK-8)
ST PAUL CHRISTIAN ACADEMY Students: 390, Location: 5035 HILLSBORO PIKE, Grades: PK-6)
ST BERNARD ACADEMY Students: 312, Location: 2020 24TH AVE S, Grades: PK-8)
CHRIST THE KING SCHOOL Students: 260, Location: 3105 BELMONT BLVD, Grades: PK-8)
LINDEN WALDORF SCHOOL Students: 185, Location: 3201 HILLSBORO PIKE, Grades: PK-8)
ST ANN SCHOOL Students: 171, Location: 5105 CHARLOTTE PIKE, Grades: KG-8)
BORN AGAIN CHRISTIAN ACADEMY Students: 150, Location: 858 W TRINITY LN, Grades: PK-4)
See full list of schools located in Nashville-Davidson Davidson County has a predicted average indoor radon screening level greater than 4 pCi/L (pico curies per liter) - Highest Potential Average household size: This city:
2.3 peopleTennessee:
2.5 people
Percentage of family households: This city:
55.4%Whole state:
67.3%
Percentage of households with unmarried partners: This city:
7.1%Whole state:
5.8%
Likely homosexual households (counted as self-reported same-sex unmarried-partner households)
Lesbian couples: 0.5% of all households Gay men: 0.6% of all households
People in group quarters in Nashville-Davidson in 2010:
13,660 people in college/university student housing
3,951 people in state prisons
2,198 people in local jails and other municipal confinement facilities
2,107 people in nursing facilities/skilled-nursing facilities
1,158 people in emergency and transitional shelters (with sleeping facilities) for people experiencing homelessness
960 people in other noninstitutional facilities
502 people in residential treatment centers for adults
323 people in group homes intended for adults
282 people in correctional residential facilities
157 people in residential treatment centers for juveniles (non-correctional)
151 people in correctional facilities intended for juveniles
123 people in mental (psychiatric) hospitals and psychiatric units in other hospitals
100 people in hospitals with patients who have no usual home elsewhere
53 people in group homes for juveniles (non-correctional)
42 people in in-patient hospice facilities
26 people in workers' group living quarters and job corps centers
People in group quarters in Nashville-Davidson in 2000:
11,313 people in college dormitories (includes college quarters off campus)
3,027 people in state prisons
2,515 people in local jails and other confinement facilities (including police lockups)
2,269 people in nursing homes
1,673 people in other noninstitutional group quarters
481 people in hospitals/wards and hospices for chronically ill
481 people in other hospitals or wards for chronically ill
458 people in mental (psychiatric) hospitals or wards
329 people in orthopedic wards and institutions for the physically handicapped
301 people in other types of correctional institutions
258 people in schools, hospitals, or wards for the intellectually disabled
226 people in homes for the mentally retarded
223 people in homes or halfway houses for drug/alcohol abuse
201 people in other group homes
172 people in training schools for juvenile delinquents
147 people in homes for abused, dependent, and neglected children
119 people in hospitals or wards for drug/alcohol abuse
113 people in religious group quarters
93 people in wards in general hospitals for patients who have no usual home elsewhere
88 people in other nonhousehold living situations
63 people in unknown juvenile institutions
15 people in homes for the mentally ill
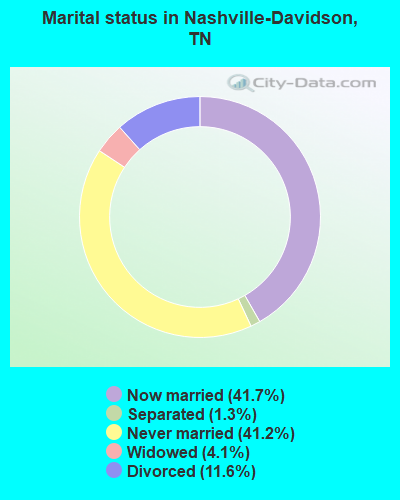
For population 15 years and over in Nashville-Davidson:
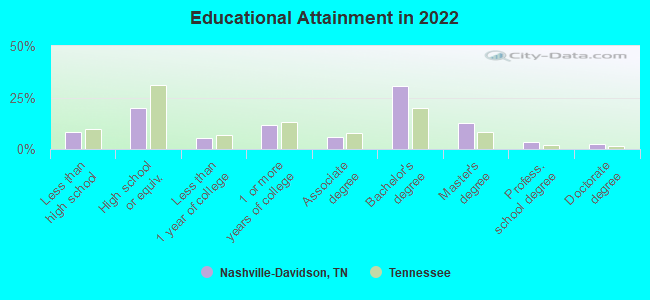
Never married: 41.2%Now married: 41.7%Separated: 1.3%Widowed: 4.1%Divorced: 11.6% For population 25 years and over in Nashville-Davidson:
High school or higher: 91.6%Bachelor's degree or higher: 48.7%Graduate or professional degree: 18.1%Unemployed: 5.3%Mean travel time to work (commute): 18.8 minutes
Education Gini index (Inequality in education) Here:
11.8Tennessee average:
11.4
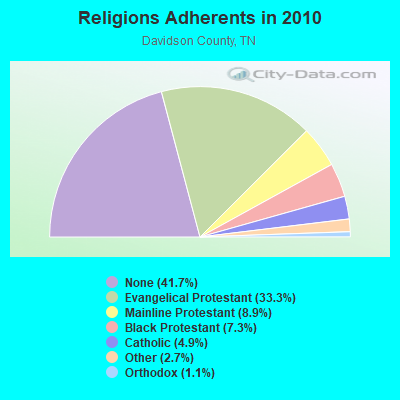
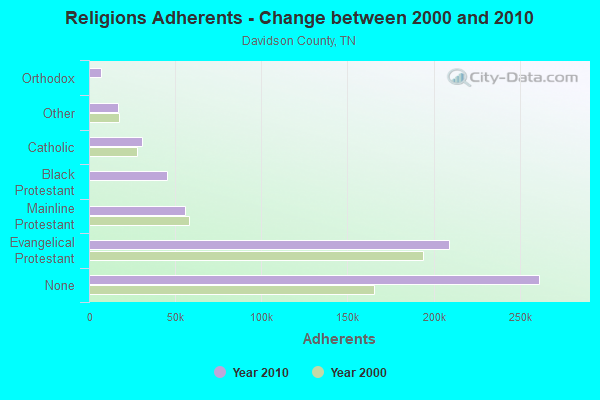
Religion statistics for Nashville-Davidson, TN (based on Davidson County data)
Religion Adherents Congregations Evangelical Protestant 208,931 485 Mainline Protestant 55,873 132 Black Protestant 45,441 86 Catholic 30,874 18 Other 17,082 51 Orthodox 7,022 10 None 261,458 -
Source: Clifford Grammich, Kirk Hadaway, Richard Houseal, Dale E.Jones, Alexei Krindatch, Richie Stanley and Richard H.Taylor. 2012. 2010 U.S.Religion Census: Religious Congregations & Membership Study. Association of Statisticians of American Religious Bodies. Jones, Dale E., et al. 2002. Congregations and Membership in the United States 2000. Nashville, TN: Glenmary Research Center. Graphs represent county-level data
Food Environment Statistics: Number of grocery stores : 125Davidson County :
2.02 / 10,000 pop.Tennessee :
1.99 / 10,000 pop.
Number of supercenters and club stores : 6Here :
0.10 / 10,000 pop.State :
0.17 / 10,000 pop.
Number of convenience stores (no gas) : 32Davidson County :
0.52 / 10,000 pop.Tennessee :
0.65 / 10,000 pop.
Number of convenience stores (with gas) : 275Davidson County :
4.43 / 10,000 pop.Tennessee :
5.16 / 10,000 pop.
Number of full-service restaurants : 546Here :
8.80 / 10,000 pop.Tennessee :
6.56 / 10,000 pop.
Adult diabetes rate : This county :
10.6%State :
11.4%
Adult obesity rate : Davidson County :
30.1%Tennessee :
30.2%
Low-income preschool obesity rate : Davidson County :
17.2%State :
13.5%
Health and Nutrition: Healthy diet rate : This city:
48.6%Tennessee:
49.3%
Average overall health of teeth and gums : Nashville-Davidson:
45.6%Tennessee:
46.1%
People feeling badly about themselves : This city:
20.0%Tennessee:
21.0%
People not drinking alcohol at all : Average hours sleeping at night : This city:
6.7Tennessee:
6.8
Overweight people : Nashville-Davidson:
32.6%Tennessee:
33.9%
General health condition : Here:
56.0%Tennessee:
55.9%
Average condition of hearing : This city:
80.6%Tennessee:
79.1%
More about Health and Nutrition of Nashville-Davidson, TN Residents
Nashville-Davidson government finances - Expenditure in 2006 (per resident):
Construction - General - Other: $178,720,000 ($261.43)
Electric Utilities: $64,945,000 ($95.00)Sewerage: $62,301,000 ($91.13)Water Utilities: $53,968,000 ($78.94)Elementary and Secondary Education: $53,437,000 ($78.17)Regular Highways: $7,341,000 ($10.74)Police Protection: $1,165,000 ($1.70)Current Operations - Electric Utilities: $826,938,000 ($1209.64)
Elementary and Secondary Education: $605,944,000 ($886.37)Police Protection: $157,192,000 ($229.94)General - Other: $139,153,000 ($203.55)Hospitals: $119,873,000 ($175.35)Local Fire Protection: $100,685,000 ($147.28)Parks and Recreation: $71,226,000 ($104.19)Judicial and Legal Services: $58,621,000 ($85.75)Correctional Institutions: $52,052,000 ($76.14)Health - Other: $48,221,000 ($70.54)Sewerage: $46,381,000 ($67.85)Transit Utilities: $39,828,000 ($58.26)Water Utilities: $39,146,000 ($57.26)Regular Highways: $31,100,000 ($45.49)Public Welfare - Other: $27,701,000 ($40.52)Financial Administration: $27,332,000 ($39.98)Libraries: $21,645,000 ($31.66)Solid Waste Management: $21,298,000 ($31.15)Central Staff Services: $18,627,000 ($27.25)Protective Inspection and Regulation - Other: $7,971,000 ($11.66)Natural Resources - Other: $4,863,000 ($7.11)Electric Utilities - Interest on Debt: $27,380,000 ($40.05)
Employee Retirement - Corporate Stocks: $1,486,322,000 ($2174.19)
Benefit Payments: $139,836,000 ($204.55)Securities - Mortgages: $116,452,000 ($170.35)Corporate Bonds: $88,236,000 ($129.07)Total Cash and Deposits: $68,241,000 ($99.82)Other Investments - Other: $36,080,000 ($52.78)General - Interest on Debt: $147,910,000 ($216.36)
Intergovernmental to Local - Other - Elementary and Secondary Education: $1,240,000 ($1.81)
Other Capital Outlay - Elementary and Secondary Education: $18,475,000 ($27.03)
General - Other: $13,745,000 ($20.11)Electric Utilities: $4,919,000 ($7.20)Parks and Recreation: $1,162,000 ($1.70)Natural Resources - Other: $571,000 ($0.84)Libraries: $110,000 ($0.16)Health - Other: $77,000 ($0.11)Public Welfare - Other: $66,000 ($0.10)Total Salaries and Wages: $598,837,000 ($875.98)
Water Utilities - Interest on Debt: $26,812,000 ($39.22)
Nashville-Davidson government finances - Revenue in 2006 (per resident):
Charges - Sewerage: $77,921,000 ($113.98)
Hospital Public: $60,253,000 ($88.14)Other: $56,148,000 ($82.13)Elementary and Secondary Education - Other: $14,010,000 ($20.49)Elementary and Secondary Education School Lunch: $9,790,000 ($14.32)Parks and Recreation: $9,187,000 ($13.44)Natural Resources - Other: $4,725,000 ($6.91)Solid Waste Management: $3,963,000 ($5.80)Elementary and Secondary Education School Tuition and Transportation: $125,000 ($0.18)Employee Retirement - Earnings on Investments (calculated): $253,394,000 ($370.66)
From Parent Local Government: $101,396,000 ($148.32)From Other Governments: $21,260,000 ($31.10)Local Employee Contribution: $112,000 ($0.16)Federal Intergovernmental - Other: $6,765,000 ($9.90)
Education: $785,000 ($1.15)Miscellaneous - Interest Earnings: $99,161,000 ($145.05)
Special Assessments: $27,708,000 ($40.53)Fines and Forfeits: $19,734,000 ($28.87)General Revenue - Other: $14,335,000 ($20.97)Donations From Private Sources: $10,901,000 ($15.95)Sale of Property: $281,000 ($0.41)Revenue - Electric Utilities: $920,753,000 ($1346.87)
Water Utilities: $77,913,000 ($113.97)Transit Utilities: $8,966,000 ($13.12)State Intergovernmental - Education: $240,510,000 ($351.82)
Other: $55,625,000 ($81.37)Public Welfare: $42,757,000 ($62.54)Health and Hospitals: $42,192,000 ($61.72)General Local Government Support: $22,995,000 ($33.64)Transit Utilities: $20,280,000 ($29.67)Highways: $11,944,000 ($17.47)Sewerage: $1,934,000 ($2.83)Tax - Property: $719,820,000 ($1052.95)
General Sales and Gross Receipts: $271,312,000 ($396.87)Other Selective Sales: $22,935,000 ($33.55)Occupation and Business License - Other: $21,341,000 ($31.22)Motor Vehicle License: $18,640,000 ($27.27)Alcoholic Beverage Sales: $17,649,000 ($25.82)Public Utilities Sales: $15,342,000 ($22.44)Other License: $13,535,000 ($19.80)Severance: $488,000 ($0.71)
Nashville-Davidson government finances - Debt in 2006 (per resident):
Long Term Debt - Outstanding Unspecified Public Purpose: $2,708,588,000 ($3962.11)
Beginning Outstanding - Unspecified Public Purpose: $2,416,874,000 ($3535.40)Beginning Outstanding - Public Debt for Private Purpose: $1,118,209,000 ($1635.71)Outstanding Nonguaranteed - Industrial Revenue: $1,117,919,000 ($1635.29)Issue, Unspecified Public Purpose: $496,030,000 ($725.59)Retired Unspecified Public Purpose: $204,316,000 ($298.87)Retired Nonguaranteed - Public Debt for Private Purpose: $45,640,000 ($66.76)Issue, Nonguaranteed - Public Debt for Private Purpose: $45,350,000 ($66.34)Short Term Debt Outstanding - Beginning: $150,000,000 ($219.42)
End of Fiscal Year: $10,000,000 ($14.63)
Nashville-Davidson government finances - Cash and Securities in 2006 (per resident):
Bond Funds - Cash and Securities: $123,173,000 ($180.18)
Employee Retirement - Total Federal Securities: $332,047,000 ($485.72)
Total Other Securities: $75,302,000 ($110.15)Other Funds - Cash and Securities: $398,694,000 ($583.21)
Sinking Funds - Cash and Securities: $1,195,226,000 ($1748.37)
9.81% of this county's 2021 resident taxpayers lived in other counties in 2020 ($81,596 average adjusted gross income )
Here:
9.81%Tennessee average:
8.49%
0.01% of residents moved from foreign countries ($54 average AGI )Davidson County:
0.01%Tennessee average:
0.02%
Top counties from which taxpayers relocated into this county between 2020 and 2021:
10.77% of this county's 2020 resident taxpayers moved to other counties in 2021 ($70,227 average adjusted gross income )
Here:
10.77%Tennessee average:
7.40%
0.01% of residents moved to foreign countries ($170 average AGI )Davidson County:
0.01%Tennessee average:
0.01%
Top counties to which taxpayers relocated from this county between 2020 and 2021: Businesses in Nashville-Davidson, TN
Strongest AM radio stations in Nashville-Davidson:
WAMB (1160 AM; 50 kW; DONELSON, TN; Owner: GREAT SOUTHERN BROADCASTING COMPANY, INC.)
WNSG (1240 AM; 1 kW; NASHVILLE, TN; Owner: MORTENSON BROADCASTING COMPANY)
WENO (760 AM; daytime; 1 kW; NASHVILLE, TN; Owner: WENO, INC.)
WKDA (1200 AM; 50 kW; NASHVILLE, TN; Owner: RADIO NASHVILLE, INC.)
WCOR (900 AM; 5 kW; LEBANON, TN)
WSM (650 AM; 50 kW; NASHVILLE, TN; Owner: GAYLORD ENTERTAINMENT COMPANY)
WNQM (1300 AM; 50 kW; NASHVILLE, TN; Owner: WNQM. INC.)
WLAC (1510 AM; 50 kW; NASHVILLE, TN; Owner: CAPSTAR TX LIMITED PARTNERSHIP)
WVOL (1470 AM; 5 kW; BERRY HILL, TN)
WPLN (1430 AM; 15 kW; MADISON, TN)
WYFN (980 AM; 5 kW; NASHVILLE, TN; Owner: BIBLE BRADCASTING NETWORK, INC.)
WMDB (880 AM; daytime; 2 kW; NASHVILLE, TN; Owner: BABB BROADCASTING COMPANY)
WNAH (1360 AM; 1 kW; NASHVILLE, TN; Owner: HERMITAGE BROADCASTING EAST)
Strongest FM radio stations in Nashville-Davidson:
WNPL (106.7 FM; BELLE MEADE, TN; Owner: CUMULUS LICENSING CORP.)
WNAZ-FM (89.1 FM; NASHVILLE, TN; Owner: TREVECCA NAZARENE UNIVERSITY, INC.)
WGFX (104.5 FM; GALLATIN, TN; Owner: CITADEL BROADCASTING COMPANY)
WSM-FM (95.5 FM; NASHVILLE, TN; Owner: CUMULUS LICENSING CORP.)
WMAK (96.3 FM; MURFREESBORO, TN; Owner: SOUTH CENTRAL COMMUNICATIONS CORP.)
WRVW (107.5 FM; LEBANON, TN; Owner: CAPSTAR TX LIMITED PARTNERSHIP)
WSIX-FM (97.9 FM; NASHVILLE, TN; Owner: CAPSTAR TX LIMITED PARTNERSHIP)
WRVU (91.1 FM; NASHVILLE, TN; Owner: VANDERBILT STUDENT COMMUNICATIONS, INC.)
WKDF (103.3 FM; NASHVILLE, TN; Owner: CITADEL BROADCASTING COMPANY)
WNRQ (105.9 FM; NASHVILLE, TN; Owner: CAPSTAR TX LIMITED PARTNERSHIP)
WPLN-FM (90.3 FM; NASHVILLE, TN; Owner: NASHVILLE PUBLIC RADIO)
WAYM (88.7 FM; COLUMBIA, TN; Owner: WAY-FM MEDIA GROUP, INC.)
W271AB (102.1 FM; NASHVILLE, TN; Owner: MONTGOMERY BROADCASTING COMPANY)
WJXA (92.9 FM; NASHVILLE, TN; Owner: SOUTH CENTRAL COMMUNICATIONS CORP.)
WRLT (100.1 FM; FRANKLIN, TN; Owner: TUNED-IN BROADCASTING, INC)
WFFI (93.7 FM; KINGSTON SPRINGS, TN; Owner: CARON BROADCASTING, INC.)
WRQQ (97.1 FM; GOODLETTSVILLE, TN; Owner: CUMULUS LICENSING CORP.)
WMOT (89.5 FM; MURFREESBORO, TN; Owner: MIDDLE TENNESSEE STATE UNIVERSITY)
WQQK (92.1 FM; HENDERSONVILLE, TN; Owner: PHOENIX OF HENDERSONVILLE, INC.)
WBUZ (102.9 FM; LA VERGNE, TN; Owner: WYCQ, INC)
TV broadcast stations around Nashville-Davidson:
W36AK (Channel 36; NASHVILLE, TN; Owner: TRINITY BROADCASTING NETWORK)
WGAP-LP (Channel 26; NASHVILLE, TN; Owner: SOUTH CENTRAL COMMUNICATIONS CORP.)
WJDE-LP (Channel 24; NASHVILLE, TN; Owner: SOUTH CENTRAL COMMUNICATIONS CORP.)
WRMX-LP (Channel 12; NASHVILLE, TN; Owner: SOUTH CENTRAL COMMUNICATIONS CORP.)
WJNK-LP (Channel 61; NASHVILLE, TN; Owner: THREE ANGELS BROADCASTING NETWORK, INC.)
W52CT (Channel 52; NASHVILLE, TN; Owner: JKB ASSOCIATES, INC.)
WSMV-TV (Channel 4; NASHVILLE, TN; Owner: MEREDITH CORPORATION)
WZTV (Channel 17; NASHVILLE, TN; Owner: WZTV LICENSEE, LLC)
WTVF (Channel 5; NASHVILLE, TN; Owner: NEWSCHANNEL 5 NETWORK, LP)
WUXP-TV (Channel 30; NASHVILLE, TN; Owner: WUXP LICENSEE, LLC)
WNPX (Channel 28; COOKEVILLE, TN; Owner: PAXSON COMMUNICATIONS LICENSE COMPANY, LLC)
WKRN-TV (Channel 2; NASHVILLE, TN; Owner: WKRN, G.P.)
WNPT (Channel 8; NASHVILLE, TN; Owner: NASHVILLE PUBLIC TELEVISION, INC.)
WNPX-LP (Channel 20; NASHVILLE, TN; Owner: PAXSON COMMUNICATIONS LPTV, INC.)
WNAB (Channel 58; NASHVILLE, TN; Owner: NASHVILLE LICENSE HOLDINGS, L.L.C.)
WHTN (Channel 39; MURFREESBORO, TN; Owner: CHRISTIAN TELEVISION NETWORK, INC.)
WPGD (Channel 50; HENDERSONVILLE, TN; Owner: TRINITY BROADCASTING NETWORK)
WIIW-LP (Channel 14; NASHVILLE, TN; Owner: EQUITY BROADCASTING CORPORATION)
WJFB (Channel 66; LEBANON, TN; Owner: BRYANT BROADCASTING, INC.)
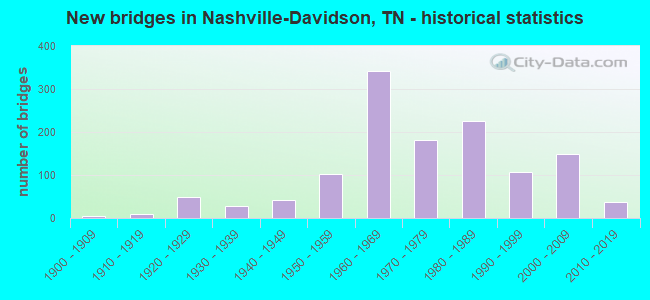
National Bridge Inventory (NBI) Statistics 1,275 Number of bridges15,341ft / 4,676m Total length $710,240,000 Total costs51,390,975 Total average daily traffic6,660,324 Total average daily truck traffic
New bridges - historical statistics
1 Before 1900 4 1900-1909 9 1910-1919 49 1920-1929 27 1930-1939 41 1940-1949 103 1950-1959 341 1960-1969 181 1970-1979 226 1980-1989 106 1990-1999 148 2000-2009 38 2010-2019 1 2020-2022
See full National Bridge Inventory statistics for Nashville-Davidson, TN
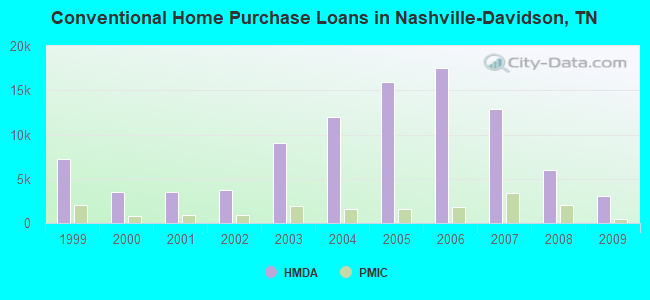
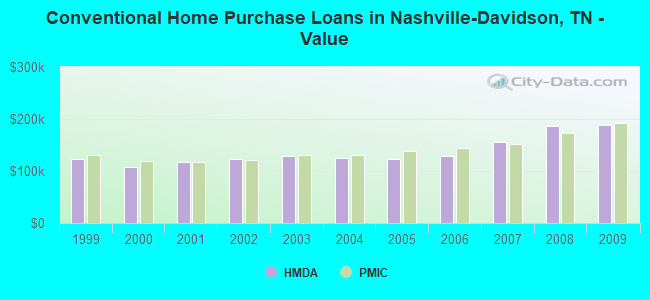
Home Mortgage Disclosure Act Aggregated Statistics For Year 2009(Based on 137 full and 3 partial tracts) A) FHA, FSA/RHS & VA B) Conventional C) Refinancings D) Home Improvement Loans E) Loans on Dwellings For 5+ Families F) Non-occupant Loans on G) Loans On Manufactured Number Average Value Number Average Value Number Average Value Number Average Value Number Average Value Number Average Value Number Average Value
LOANS ORIGINATED 3,917 $154,153 3,084 $188,297 11,764 $184,784 392 $89,736 27 $3,449,963 1,376 $148,157 29 $87,970 APPLICATIONS APPROVED, NOT ACCEPTED 139 $146,294 219 $214,881 1,069 $165,336 108 $43,032 2 $813,000 88 $128,805 4 $32,960 APPLICATIONS DENIED 497 $148,137 532 $154,607 4,472 $164,030 610 $37,491 3 $418,667 429 $114,791 36 $65,943 APPLICATIONS WITHDRAWN 626 $153,605 642 $197,397 2,978 $177,193 109 $82,167 2 $16,361,500 279 $136,985 4 $105,998 FILES CLOSED FOR INCOMPLETENESS 81 $158,247 77 $193,080 689 $180,710 41 $96,489 3 $3,378,333 48 $125,285 2 $114,500
Aggregated Statistics For Year 2008(Based on 138 full and 3 partial tracts) A) FHA, FSA/RHS & VA B) Conventional C) Refinancings D) Home Improvement Loans E) Loans on Dwellings For 5+ Families F) Non-occupant Loans on G) Loans On Manufactured Number Average Value Number Average Value Number Average Value Number Average Value Number Average Value Number Average Value Number Average Value
LOANS ORIGINATED 2,843 $152,611 5,951 $186,428 7,597 $169,378 784 $70,720 33 $2,708,848 2,492 $145,382 38 $69,014 APPLICATIONS APPROVED, NOT ACCEPTED 128 $152,422 570 $181,946 1,019 $157,537 186 $50,817 0 $0 247 $140,968 15 $76,533 APPLICATIONS DENIED 518 $147,474 952 $157,603 5,223 $149,709 1,221 $45,400 6 $1,960,333 779 $117,361 47 $56,737 APPLICATIONS WITHDRAWN 477 $149,029 955 $187,400 2,328 $166,081 144 $86,415 6 $9,521,000 391 $129,674 11 $91,930 FILES CLOSED FOR INCOMPLETENESS 70 $147,178 168 $191,831 558 $167,439 47 $93,336 0 $0 75 $163,840 2 $66,500
Aggregated Statistics For Year 2007(Based on 138 full and 3 partial tracts) A) FHA, FSA/RHS & VA B) Conventional C) Refinancings D) Home Improvement Loans E) Loans on Dwellings For 5+ Families F) Non-occupant Loans on G) Loans On Manufactured Number Average Value Number Average Value Number Average Value Number Average Value Number Average Value Number Average Value Number Average Value
LOANS ORIGINATED 1,456 $142,882 12,916 $156,673 8,230 $151,414 1,135 $76,117 54 $3,822,324 3,549 $136,681 46 $81,122 APPLICATIONS APPROVED, NOT ACCEPTED 62 $145,016 1,683 $141,645 1,724 $141,027 302 $55,637 1 $12,500,000 494 $110,047 14 $75,571 APPLICATIONS DENIED 363 $131,439 2,419 $141,537 6,824 $140,386 1,460 $53,551 5 $524,000 1,091 $113,294 80 $95,159 APPLICATIONS WITHDRAWN 236 $135,331 1,651 $143,927 3,081 $145,224 280 $100,705 9 $1,744,222 479 $123,997 13 $107,577 FILES CLOSED FOR INCOMPLETENESS 35 $141,800 371 $164,156 1,030 $162,867 29 $140,276 0 $0 120 $143,624 1 $172,000
Aggregated Statistics For Year 2006(Based on 137 full and 3 partial tracts) A) FHA, FSA/RHS & VA B) Conventional C) Refinancings D) Home Improvement Loans E) Loans on Dwellings For 5+ Families F) Non-occupant Loans on G) Loans On Manufactured Number Average Value Number Average Value Number Average Value Number Average Value Number Average Value Number Average Value Number Average Value
LOANS ORIGINATED 1,593 $137,168 17,568 $129,705 8,942 $135,429 1,221 $60,629 69 $3,931,797 4,708 $115,911 95 $55,615 APPLICATIONS APPROVED, NOT ACCEPTED 71 $135,835 2,336 $118,318 2,163 $120,474 318 $57,693 3 $198,333 623 $102,967 92 $57,282 APPLICATIONS DENIED 244 $127,160 3,720 $109,705 7,266 $126,584 1,606 $44,879 9 $525,333 1,401 $88,713 188 $66,218 APPLICATIONS WITHDRAWN 296 $133,657 2,637 $122,829 4,646 $130,445 299 $70,640 5 $694,800 703 $102,170 19 $95,893 FILES CLOSED FOR INCOMPLETENESS 24 $125,417 573 $123,870 1,190 $140,067 38 $82,421 1 $8,407,000 149 $104,221 1 $89,000
Aggregated Statistics For Year 2005(Based on 139 full and 3 partial tracts) A) FHA, FSA/RHS & VA B) Conventional C) Refinancings D) Home Improvement Loans E) Loans on Dwellings For 5+ Families F) Non-occupant Loans on G) Loans On Manufactured Number Average Value Number Average Value Number Average Value Number Average Value Number Average Value Number Average Value Number Average Value
LOANS ORIGINATED 1,935 $128,358 15,964 $122,923 9,932 $129,214 1,011 $69,072 56 $3,063,518 3,889 $108,252 95 $51,652 APPLICATIONS APPROVED, NOT ACCEPTED 96 $127,048 1,918 $108,170 2,290 $112,116 235 $50,514 1 $11,850,000 380 $96,236 113 $48,951 APPLICATIONS DENIED 351 $117,511 3,231 $100,349 8,498 $118,691 1,317 $38,915 6 $1,038,667 974 $92,874 250 $52,727 APPLICATIONS WITHDRAWN 293 $128,989 2,639 $121,854 6,695 $128,727 466 $115,326 3 $581,000 670 $100,892 37 $85,483 FILES CLOSED FOR INCOMPLETENESS 34 $116,912 759 $101,261 1,020 $131,742 50 $54,460 0 $0 128 $98,132 4 $93,500
Aggregated Statistics For Year 2004(Based on 139 full and 3 partial tracts) A) FHA, FSA/RHS & VA B) Conventional C) Refinancings D) Home Improvement Loans E) Loans on Dwellings For 5+ Families F) Non-occupant Loans on G) Loans On Manufactured Number Average Value Number Average Value Number Average Value Number Average Value Number Average Value Number Average Value Number Average Value
LOANS ORIGINATED 2,410 $123,544 11,980 $124,347 11,103 $123,804 978 $50,001 41 $2,510,732 2,701 $98,191 125 $47,837 APPLICATIONS APPROVED, NOT ACCEPTED 117 $116,547 1,581 $113,181 2,549 $112,239 237 $33,059 5 $1,157,600 387 $96,380 121 $45,634 APPLICATIONS DENIED 457 $114,709 2,731 $103,299 8,288 $109,913 1,305 $33,115 8 $515,625 839 $85,421 317 $50,381 APPLICATIONS WITHDRAWN 288 $125,132 1,612 $119,921 5,435 $118,630 172 $61,396 2 $310,500 428 $96,878 30 $76,767 FILES CLOSED FOR INCOMPLETENESS 53 $118,721 629 $93,264 870 $117,975 47 $61,331 0 $0 93 $88,334 4 $98,058
Aggregated Statistics For Year 2003(Based on 139 full and 3 partial tracts) A) FHA, FSA/RHS & VA B) Conventional C) Refinancings D) Home Improvement Loans E) Loans on Dwellings For 5+ Families F) Non-occupant Loans on Number Average Value Number Average Value Number Average Value Number Average Value Number Average Value Number Average Value
LOANS ORIGINATED 3,146 $123,369 9,059 $129,066 24,215 $128,637 698 $28,961 27 $2,266,370 2,785 $89,739 APPLICATIONS APPROVED, NOT ACCEPTED 109 $116,872 1,278 $112,047 3,716 $113,015 219 $39,121 6 $466,667 347 $82,653 APPLICATIONS DENIED 499 $116,325 2,231 $94,228 8,007 $108,725 830 $23,319 4 $227,500 749 $83,407 APPLICATIONS WITHDRAWN 322 $123,977 1,183 $127,142 5,144 $119,153 86 $55,449 2 $835,000 373 $91,727 FILES CLOSED FOR INCOMPLETENESS 48 $130,062 579 $104,892 1,069 $120,231 18 $23,667 0 $0 123 $85,652
Aggregated Statistics For Year 2002(Based on 83 full and 1 partial tracts) A) FHA, FSA/RHS & VA B) Conventional C) Refinancings D) Home Improvement Loans E) Loans on Dwellings For 5+ Families F) Non-occupant Loans on Number Average Value Number Average Value Number Average Value Number Average Value Number Average Value Number Average Value
LOANS ORIGINATED 1,260 $110,394 3,714 $122,527 7,837 $123,658 418 $27,630 21 $1,066,000 1,595 $82,223 APPLICATIONS APPROVED, NOT ACCEPTED 40 $109,503 509 $101,048 1,385 $103,616 107 $26,408 1 $171,000 199 $73,594 APPLICATIONS DENIED 249 $103,357 1,075 $81,812 3,192 $101,995 466 $21,556 0 $0 400 $76,954 APPLICATIONS WITHDRAWN 128 $108,623 503 $118,857 1,863 $107,127 43 $42,115 3 $700,000 196 $73,219 FILES CLOSED FOR INCOMPLETENESS 18 $108,889 258 $97,916 478 $111,290 3 $41,000 0 $0 60 $77,009
Aggregated Statistics For Year 2001(Based on 83 full and 1 partial tracts) A) FHA, FSA/RHS & VA B) Conventional C) Refinancings D) Home Improvement Loans E) Loans on Dwellings For 5+ Families F) Non-occupant Loans on Number Average Value Number Average Value Number Average Value Number Average Value Number Average Value Number Average Value
LOANS ORIGINATED 1,343 $106,175 3,531 $117,155 6,412 $115,760 648 $25,053 29 $1,433,931 1,198 $76,686 APPLICATIONS APPROVED, NOT ACCEPTED 40 $113,250 435 $86,570 1,041 $91,596 147 $22,955 7 $264,571 136 $62,682 APPLICATIONS DENIED 158 $99,416 1,130 $79,527 3,508 $88,361 561 $18,143 2 $122,500 313 $72,548 APPLICATIONS WITHDRAWN 142 $105,502 482 $106,673 1,879 $91,827 78 $41,333 3 $277,667 148 $92,177 FILES CLOSED FOR INCOMPLETENESS 26 $88,192 226 $77,349 454 $95,855 9 $32,556 0 $0 39 $68,333
Aggregated Statistics For Year 2000(Based on 83 full and 1 partial tracts) A) FHA, FSA/RHS & VA B) Conventional C) Refinancings D) Home Improvement Loans E) Loans on Dwellings For 5+ Families F) Non-occupant Loans on Number Average Value Number Average Value Number Average Value Number Average Value Number Average Value Number Average Value
LOANS ORIGINATED 1,322 $96,249 3,470 $108,054 2,791 $89,747 705 $20,126 7 $1,040,714 668 $70,738 APPLICATIONS APPROVED, NOT ACCEPTED 83 $68,039 605 $72,341 823 $82,127 223 $21,594 1 $81,000 146 $76,131 APPLICATIONS DENIED 235 $79,616 1,451 $63,641 2,866 $105,562 625 $20,983 1 $216,000 310 $65,170 APPLICATIONS WITHDRAWN 156 $95,373 505 $101,911 1,619 $71,419 115 $29,228 3 $316,667 119 $70,118 FILES CLOSED FOR INCOMPLETENESS 19 $102,158 273 $71,660 477 $83,392 5 $36,200 0 $0 50 $65,020
Aggregated Statistics For Year 1999(Based on 106 full and 3 partial tracts) A) FHA, FSA/RHS & VA B) Conventional C) Refinancings D) Home Improvement Loans E) Loans on Dwellings For 5+ Families F) Non-occupant Loans on Number Average Value Number Average Value Number Average Value Number Average Value Number Average Value Number Average Value
LOANS ORIGINATED 3,372 $104,777 7,227 $122,241 8,726 $100,366 1,481 $19,692 24 $1,761,702 1,338 $69,523 APPLICATIONS APPROVED, NOT ACCEPTED 88 $108,139 983 $90,821 2,605 $81,703 358 $18,769 3 $152,277 256 $66,221 APPLICATIONS DENIED 393 $97,923 2,397 $72,332 5,095 $92,193 1,196 $15,173 8 $1,409,748 375 $80,216 APPLICATIONS WITHDRAWN 322 $101,615 1,113 $106,019 3,377 $81,328 166 $43,549 2 $159,500 237 $69,428 FILES CLOSED FOR INCOMPLETENESS 45 $103,259 408 $98,071 941 $88,214 20 $37,702 0 $0 57 $56,355
Detailed mortgage data for all 142 tracts in Nashville Davidson, TN
Private Mortgage Insurance Companies Aggregated Statistics For Year 2009(Based on 129 full and 3 partial tracts) A) Conventional B) Refinancings C) Non-occupant Loans on Number Average Value Number Average Value Number Average Value
LOANS ORIGINATED 501 $192,601 384 $188,894 20 $199,200 APPLICATIONS APPROVED, NOT ACCEPTED 158 $181,851 153 $194,361 18 $146,389 APPLICATIONS DENIED 70 $180,657 83 $184,217 11 $149,000 APPLICATIONS WITHDRAWN 23 $187,913 49 $203,806 4 $249,250 FILES CLOSED FOR INCOMPLETENESS 32 $173,000 16 $194,188 11 $142,182
Aggregated Statistics For Year 2008(Based on 133 full and 3 partial tracts) A) Conventional B) Refinancings C) Non-occupant Loans on D) Loans On Manufactured Number Average Value Number Average Value Number Average Value Number Average Value
LOANS ORIGINATED 2,081 $172,189 758 $173,141 311 $150,331 0 $0 APPLICATIONS APPROVED, NOT ACCEPTED 693 $164,287 390 $168,682 124 $135,906 6 $137,333 APPLICATIONS DENIED 186 $157,117 52 $161,096 93 $150,026 0 $0 APPLICATIONS WITHDRAWN 101 $170,500 42 $153,095 28 $149,607 0 $0 FILES CLOSED FOR INCOMPLETENESS 54 $155,889 20 $163,500 27 $144,519 0 $0
Aggregated Statistics For Year 2007(Based on 134 full and 2 partial tracts) A) Conventional B) Refinancings C) Non-occupant Loans on D) Loans On Manufactured Number Average Value Number Average Value Number Average Value Number Average Value
LOANS ORIGINATED 3,432 $151,658 940 $152,669 420 $129,063 2 $72,500 APPLICATIONS APPROVED, NOT ACCEPTED 461 $155,550 254 $157,806 81 $120,543 3 $92,667 APPLICATIONS DENIED 70 $152,119 27 $151,556 21 $141,667 0 $0 APPLICATIONS WITHDRAWN 153 $163,662 67 $172,761 23 $163,043 0 $0 FILES CLOSED FOR INCOMPLETENESS 19 $149,947 13 $171,077 1 $197,000 0 $0
Aggregated Statistics For Year 2006(Based on 134 full and 3 partial tracts) A) Conventional B) Refinancings C) Non-occupant Loans on D) Loans On Manufactured Number Average Value Number Average Value Number Average Value Number Average Value
LOANS ORIGINATED 1,773 $144,861 617 $149,349 284 $117,555 1 $106,220 APPLICATIONS APPROVED, NOT ACCEPTED 223 $154,550 200 $140,650 47 $113,367 0 $0 APPLICATIONS DENIED 49 $158,531 21 $139,476 27 $147,926 0 $0 APPLICATIONS WITHDRAWN 74 $145,378 40 $145,869 13 $132,692 0 $0 FILES CLOSED FOR INCOMPLETENESS 4 $98,902 8 $196,750 1 $44,000 0 $0
Aggregated Statistics For Year 2005(Based on 134 full and 3 partial tracts) A) Conventional B) Refinancings C) Non-occupant Loans on D) Loans On Manufactured Number Average Value Number Average Value Number Average Value Number Average Value
LOANS ORIGINATED 1,537 $137,832 789 $137,471 343 $97,751 4 $95,082 APPLICATIONS APPROVED, NOT ACCEPTED 211 $137,477 215 $145,509 51 $96,922 0 $0 APPLICATIONS DENIED 25 $156,166 19 $120,526 14 $97,868 1 $144,000 APPLICATIONS WITHDRAWN 87 $132,898 58 $132,069 28 $106,429 1 $120,000 FILES CLOSED FOR INCOMPLETENESS 14 $117,643 12 $128,250 6 $126,167 0 $0
Aggregated Statistics For Year 2004(Based on 134 full and 3 partial tracts) A) Conventional B) Refinancings C) Non-occupant Loans on D) Loans On Manufactured Number Average Value Number Average Value Number Average Value Number Average Value
LOANS ORIGINATED 1,634 $131,113 1,018 $130,681 355 $93,041 0 $0 APPLICATIONS APPROVED, NOT ACCEPTED 274 $148,227 376 $132,692 52 $84,686 1 $96,290 APPLICATIONS DENIED 22 $124,409 13 $137,308 13 $124,385 0 $0 APPLICATIONS WITHDRAWN 115 $129,790 109 $139,163 42 $88,167 0 $0 FILES CLOSED FOR INCOMPLETENESS 14 $122,714 14 $116,929 3 $76,667 0 $0
Aggregated Statistics For Year 2003(Based on 135 full and 3 partial tracts) A) Conventional B) Refinancings C) Non-occupant Loans on Number Average Value Number Average Value Number Average Value
LOANS ORIGINATED 1,910 $130,594 2,874 $131,513 330 $89,079 APPLICATIONS APPROVED, NOT ACCEPTED 259 $122,687 570 $133,385 74 $84,940 APPLICATIONS DENIED 37 $132,459 41 $129,700 17 $104,882 APPLICATIONS WITHDRAWN 84 $140,945 170 $137,610 27 $86,829 FILES CLOSED FOR INCOMPLETENESS 7 $147,000 6 $117,833 1 $200,000
Aggregated Statistics For Year 2002(Based on 79 full and 1 partial tracts) A) Conventional B) Refinancings C) Non-occupant Loans on Number Average Value Number Average Value Number Average Value
LOANS ORIGINATED 853 $122,026 911 $119,351 177 $86,361 APPLICATIONS APPROVED, NOT ACCEPTED 126 $121,389 206 $116,572 44 $83,816 APPLICATIONS DENIED 17 $113,765 38 $123,262 12 $84,750 APPLICATIONS WITHDRAWN 44 $156,806 58 $115,056 16 $94,312 FILES CLOSED FOR INCOMPLETENESS 13 $176,538 9 $119,556 2 $117,500
Aggregated Statistics For Year 2001(Based on 78 full and 1 partial tracts) A) Conventional B) Refinancings C) Non-occupant Loans on Number Average Value Number Average Value Number Average Value
LOANS ORIGINATED 909 $117,952 629 $117,048 158 $78,513 APPLICATIONS APPROVED, NOT ACCEPTED 98 $125,991 106 $113,683 26 $76,808 APPLICATIONS DENIED 12 $127,417 30 $116,133 7 $94,571 APPLICATIONS WITHDRAWN 14 $102,786 16 $126,188 5 $59,600 FILES CLOSED FOR INCOMPLETENESS 4 $154,750 6 $112,833 1 $119,000
Aggregated Statistics For Year 2000(Based on 78 full and 1 partial tracts) A) Conventional B) Refinancings C) Non-occupant Loans on Number Average Value Number Average Value Number Average Value
LOANS ORIGINATED 806 $120,069 223 $102,862 95 $76,404 APPLICATIONS APPROVED, NOT ACCEPTED 74 $119,325 43 $111,372 14 $66,357 APPLICATIONS DENIED 21 $101,048 16 $104,711 4 $72,000 APPLICATIONS WITHDRAWN 17 $91,706 10 $98,500 7 $74,857 FILES CLOSED FOR INCOMPLETENESS 7 $111,857 1 $90,000 1 $67,000
Aggregated Statistics For Year 1999(Based on 97 full and 3 partial tracts) A) Conventional B) Refinancings C) Non-occupant Loans on Number Average Value Number Average Value Number Average Value
LOANS ORIGINATED 2,010 $131,127 865 $109,225 118 $85,510 APPLICATIONS APPROVED, NOT ACCEPTED 144 $133,847 119 $116,570 13 $89,358 APPLICATIONS DENIED 58 $114,972 29 $117,065 7 $82,701 APPLICATIONS WITHDRAWN 32 $122,200 23 $93,570 1 $51,000 FILES CLOSED FOR INCOMPLETENESS 13 $144,632 13 $107,332 2 $59,905
Nashville-Davidson compared to Tennessee state average:
Median house value above state average. Unemployed percentage below state average. Black race population percentage above state average. Hispanic race population percentage above state average. Median age below state average. Foreign-born population percentage significantly above state average. Percentage of population with a bachelor's degree or higher significantly above state average. Nashville-Davidson, TN compared to other similar cities: Nashville-Davidson on our top lists :
#17 on the list of "Top 101 cities with the highest number of assaults per 100,000 residents, excludes tourist destinations and others with a lot of outsiders visiting based on city industries data (population 50,000+)"
#18 on the list of "Top 100 cities with largest land areas (pop. 50,000+)"
#30 on the list of "Top 101 biggest cities in 2013"
#30 on the list of "Top 100 biggest cities"
#38 on the list of "Top 101 cities with largest percentage of males in occupations: arts, design, entertainment, sports, and media occupations (population 50,000+)"
#65 on the list of "Top 101 cities with the largest percentage of high school students in private schools (3,000+ students)"
#67 on the list of "Top 101 cities with the lowest percentage of family households, population 100,000+"
#72 on the list of "Top 101 cities with the largest percentage of likely gay men couples (counted as self-reported male-male unmarried-partner households) (population 50,000+)"
#84 on the list of "Top 101 cities with the highest city-data.com crime index, excludes tourist destinations and others with a lot of outsiders visiting based on city industries data (population 50,000+)"
#94 on the list of "Top 101 cities with the largest percentage of likely homosexual households (counted as self-reported same-sex unmarried-partner households) (population 50,000+)"
#95 on the list of "Top 101 cities with largest percentage of females in industries: administrative and support and waste management services (population 50,000+)"
#98 on the list of "Top 101 cities with the biggest property tax revenues per resident (population 10,000+)"
#100 on the list of "Top 101 cities with the highest number of robberies per 100,000 residents, excludes tourist destinations and others with a lot of outsiders visiting based on city industries data (population 50,000+)"
#3 (37203) on the list of "Top 101 zip codes with the highest 2012 average reported profit/loss from business (pop 5,000+)"
#5 (37201) on the list of "Top 101 zip codes with the largest charity contributions deductions as a percentage of AGI in 2012 (pop 1,000+)"
#9 (37203) on the list of "Top 101 zip codes with the most offices of physicians in 2005"
#23 (37214) on the list of "Top 101 zip codes with the most hotels or motels in 2005"
#27 (37217) on the list of "Top 101 zip codes with the largest percentage of Arab first ancestries"
#49 (37203) on the list of "Top 101 zip codes with the most Internet business establishments in 2005"
#84 (37203) on the list of "Top 101 zip codes with the most big companies in 2005 (at least 1000 employees)"
#86 (37203) on the list of "Top 101 zip codes with the most full service restaurants in 2005"
#92 (37203) on the list of "Top 101 zip codes with the most medium-big companies in 2005 (at least 100 employees)"
#100 (37220) on the list of "Top 101 zip codes with the largest percentage of taxpayers reporting profit/loss from business in 2012 (pop 5,000+)"
#15 on the list of "Top 101 counties with the most Black Protestant adherents"
#21 on the list of "Top 101 counties with the most Evangelical Protestant adherents"
#25 on the list of "Top 101 counties with the most Black Protestant congregations"
#33 on the list of "Top 101 counties with the most Evangelical Protestant congregations"
#40 on the list of "Top 101 counties with the most Orthodox adherents"


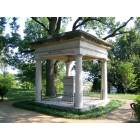


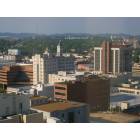
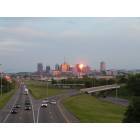
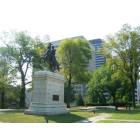
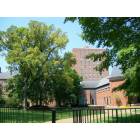
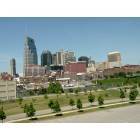
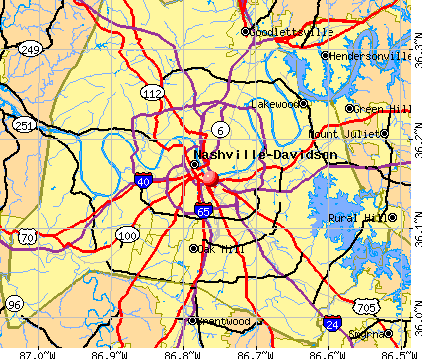


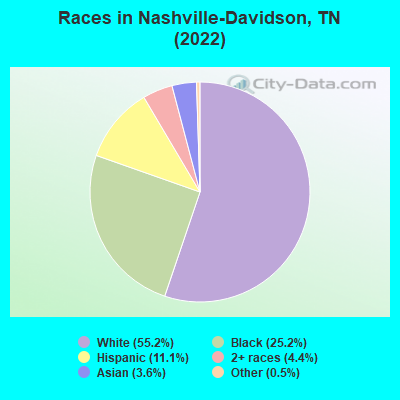
 Recent articles from our blog. Our writers, many of them Ph.D. graduates or candidates, create easy-to-read articles on a wide variety of topics.

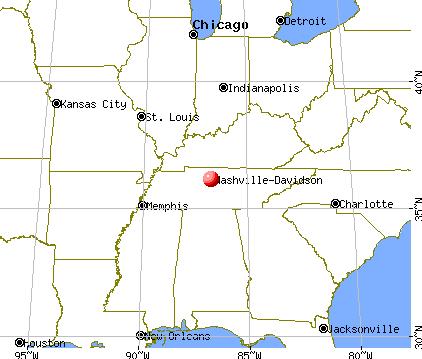
 (396.3 miles