

The latest annual survey of hours and earnings is out today and it provides an amazing insight into wages across the UK.
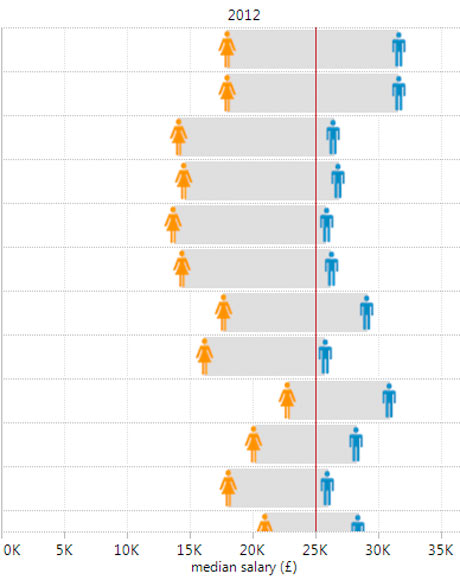
The figures, from the ONS' Annual Survey of Hours and Earnings show, for example, that the gender pay gap has fallen by 0.3% to 19.5% over the past year. That improvement followed an increase of 1.9% in the average hourly pay of full-time women workers to £11.91, compared with a modest 0.8% rise in men's pay to £13.11. The negative gender pay difference for part-time workers widened from -4.3% in 2010 to -5.6% in 2011.
We have gone for median earnings compare to the mean as this can be distorted by higher salaries. The figures above are based on median hourly earnings for all employees apart from the male and female hourly wage which is based on full-time workers only.
Based on a 1% sample of employee jobs, ASHE, draws from the HM Revenue and Customs Pay As You Earn (PAYE) records. The ONS release today also shows the number of men and women that make up the UK employee workforce - there are 12.8m males and 12.3m females.
 Click here to explore our interactive graphic
Use the above interactive, created by Maxime Marboeuf of Tableau, to see how your job and salary compare. The interactive shows the median full-time salary for an occupation and allows you to compare salary by gender.
There is a difference in the proportion of male and female employees who work full or part-time. Whilst 88% of males worked in full-time jobs with only 12% holding part-time positions, this number is drastically different for women. Women are much more likely to have part-time jobs with 42% of females in a part-time occupation and 58% in full-time. Women are therefore more likely to receive lower rates of pay.
Click here for the full screen versionThe Many Eyes visualisation illustrates the full time salaries (combined men and women) by occupation. Use the salary slider to see how salaries compare by occupation.
The figures also give us a complete guide to who gets paid what for each job in the country, by sex and occupation. These are figures we're bringing you today, with over 400 jobs indexed here and on the attached google spreadsheet. We've gone for the median figure, because it's a better indicator than the average (which can be distorted by high or low individuals).
The data is below. What can you do with it?
Data summary
|
ID
|
Description
|
2011 Median pay
|
% change in median, 10-11
|
2011 median, man
|
2011 median, female
|
|---|---|---|---|---|---|
|
SOURCE: ONS |
|||||
| 1 | All employees | 21,326 | 0.5 | 28,409 | 22,910 |
| 2 | Managers and senior officials | 36,382 | 0.5 | 42,158 | 31,878 |
| 3 | Corporate managers | 38,091 | 0.7 | 44,160 | 33,277 |
| 4 | Corporate Managers And Senior Officials | 77,679 | 7.1 | 98,010 | 59,745 |
| 5 | Senior officials in national government | 80,053 | |||
| 6 | Directors and chief executives of major organisations | 112,157 | 15 | 120,236 | |
| 7 | Senior officials in local government | 36,812 | 47,011 | 41,780 | |
| 8 | Senior officials of special interest organisations | 37,499 | 32,556 | ||
| 9 | Production Managers | 40,185 | 0.5 | 42,789 | 35,101 |
| 10 | Production, works and maintenance managers | 39,994 | 1.2 | 42,661 | 34,945 |
| 11 | Managers in construction | 40,484 | -0.7 | 41,843 | |
| 12 | Managers in mining and energy | 53,741 | -0.8 | 52,703 | |
| 13 | Functional Managers | 45,627 | 0.4 | 51,414 | 39,855 |
| 14 | Financial managers and chartered secretaries | 53,944 | 3.7 | 68,102 | 43,260 |
| 15 | Marketing and sales managers | 44,163 | -0.5 | 49,147 | 37,302 |
| 16 | Purchasing managers | 42,735 | 1.5 | 47,380 | 37,719 |
| 17 | Advertising and public relations managers | 38,178 | 2.1 | 46,551 | 34,749 |
| 18 | Personnel, training and industrial relations managers | 41,466 | 0.9 | 46,024 | 41,178 |
| 19 | Information and communication technology managers | 46,353 | 1.8 | 48,903 | 39,265 |
| 20 | Research and development managers | 46,854 | -0.5 | 50,901 | 41,122 |
| 21 | Quality And Customer Care Managers | 34,787 | 1.3 | 38,227 | 32,032 |
| 22 | Quality assurance managers | 37,195 | 1.7 | 38,879 | 37,980 |
| 23 | Customer care managers | 33,056 | 1.6 | 37,886 | 29,648 |
| 24 | Financial Institution And Office Managers | 32,647 | 2.6 | 43,077 | 30,221 |
| 25 | Financial institution managers | 43,141 | 7.7 | 48,197 | 38,381 |
| 26 | Office managers | 29,400 | 2.2 | 40,000 | 28,557 |
| 27 | Managers In Distribution, Storage And Retailing | 25,535 | 0 | 29,128 | 20,910 |
| 28 | Transport and distribution managers | 35,510 | 3.8 | 36,009 | 35,001 |
| 29 | Storage and warehouse managers | 28,398 | 1.7 | 29,658 | 25,316 |
| 30 | Retail and wholesale managers | 22,778 | -0.5 | 27,128 | 19,740 |
| 31 | Protective Service Officers | 49,394 | 5.4 | 51,470 | 45,903 |
| 32 | Officers in armed forces | ||||
| 33 | Police officers (inspectors and above) | 58,746 | 3.8 | 58,921 | 55,732 |
| 34 | Senior officers in fire, ambulance, prison and related services | 37,596 | -3.8 | 37,559 | 41,896 |
| 35 | Security managers | 35,476 | 10.5 | 37,054 | 36,377 |
| 36 | Health And Social Services Managers | 34,986 | -0.7 | 42,586 | 35,142 |
| 37 | Hospital and health service managers | 43,523 | 2.4 | 49,367 | 43,263 |
| 38 | Pharmacy managers | 36,883 | -2.6 | 49,685 | 32,688 |
| 39 | Healthcare practice managers | 24,849 | -2 | 26,562 | |
| 40 | Social services managers | 35,896 | -4.2 | 41,520 | 34,773 |
| 41 | Residential and day care managers | 29,596 | 2.3 | 31,712 | 30,000 |
| 42 | Managers and proprietors in agriculture and services | 25,855 | -2.4 | 30,110 | 24,000 |
| 43 | Managers In Farming, Horticulture, Forestry And Fishing | 27,481 | -0.4 | 28,464 | 29,973 |
| 44 | Farm managers | 25,257 | -4 | 26,725 | |
| 45 | Natural environment and conservation managers | 34,858 | 30,878 | ||
| 46 | Managers in animal husbandry, forestry and fishing n.e.c. | 27,488 | 6.9 | 27,587 | |
| 47 | Managers And Proprietors In Hospitality And Leisure Services | 20,954 | 0.6 | 23,198 | 21,320 |
| 48 | Hotel and accommodation managers | 25,458 | 2.5 | 28,240 | 26,437 |
| 49 | Conference and exhibition managers | 27,996 | 1.4 | 28,244 | 32,575 |
| 50 | Restaurant and catering managers | 19,609 | 2.6 | 22,046 | 19,536 |
| 51 | Publicans and managers of licensed premises | 18,951 | -5.7 | 20,555 | 19,006 |
| 52 | Leisure and sports managers | 23,882 | 0.4 | 27,011 | 22,165 |
| 53 | Travel agency managers | 23,738 | |||
| 54 | Managers And Proprietors In Other Service Industries | 31,539 | -1.3 | 36,567 | 28,626 |
| 55 | Property, housing and land managers | 33,799 | -2.2 | 37,668 | 30,632 |
| 56 | Garage managers and proprietors | ||||
| 57 | Hairdressing and beauty salon managers and proprietors | 17,908 | |||
| 58 | Shopkeepers and wholesale/retail dealers | 17,935 | -4.8 | 27,235 | |
| 59 | Recycling and refuse disposal managers | 35,457 | 6.3 | 42,703 | 27,220 |
| 60 | Managers and proprietors in other services n.e.c. | 31,698 | -0.9 | 38,501 | 27,264 |
| 61 | Professional occupations | 34,699 | 1 | 39,135 | 34,922 |
| 62 | Science and technology professionals | 36,687 | 0.9 | 38,143 | 32,635 |
| 63 | Science Professionals | 34,260 | 1.4 | 39,207 | 32,491 |
| 64 | Chemists | 31,920 | 2.3 | 33,919 | 30,113 |
| 65 | Biological scientists and biochemists | 33,809 | 3.3 | 39,240 | 33,505 |
| 66 | Physicists, geologists and meteorologists | 40,927 | 4.3 | 42,796 | |
| 67 | Engineering Professionals | 36,386 | 1.8 | 37,429 | 30,023 |
| 68 | Civil engineers | 35,009 | -0.3 | 35,840 | 28,895 |
| 69 | Mechanical engineers | 39,142 | 3.2 | 40,851 | 31,407 |
| 70 | Electrical engineers | 43,156 | 1.5 | 45,102 | 29,001 |
| 71 | Electronics engineers | 43,772 | -2.9 | 44,113 | |
| 72 | Chemical engineers | ||||
| 73 | Design and development engineers | 35,445 | 2.7 | 36,039 | 30,246 |
| 74 | Production and process engineers | 34,616 | 0.5 | 34,883 | |
| 75 | Planning and quality control engineers | 30,515 | 1.5 | 33,002 | 27,745 |
| 76 | Engineering professionals n.e.c. | 36,991 | 0.6 | 37,950 | 31,023 |
| 77 | Information And Communication Technology Professionals | 37,498 | -0.1 | 38,931 | 35,478 |
| 78 | IT strategy and planning professionals | 42,931 | -5.5 | 44,295 | |
| 79 | Software professionals | 36,634 | 0.9 | 37,580 | 34,213 |
| 80 | Health professionals | 48,775 | -2.7 | 80,159 | 44,788 |
| 81 | Health Professionals | 48,775 | -2.7 | 80,159 | 44,788 |
| 82 | Medical practitioners | 69,952 | -0.6 | 92,190 | 63,775 |
| 83 | Psychologists | 32,442 | -5.7 | 43,842 | 35,857 |
| 84 | Pharmacists/pharmacologists | 36,211 | 2.8 | 41,370 | 37,321 |
| 85 | Ophthalmic opticians | 33,452 | 2 | 35,340 | 38,618 |
| 86 | Dental practitioners | ||||
| 87 | Veterinarians | 32,970 | 1.7 | 33,036 | |
| 88 | Teaching and research professionals | 32,822 | 0.7 | 38,337 | 34,953 |
| 89 | Teaching Professionals | 33,134 | 0.6 | 39,194 | 35,253 |
| 90 | Higher education teaching professionals | 42,263 | 3 | 47,061 | 43,617 |
| 91 | Further education teaching professionals | 28,606 | 2.4 | 35,091 | 32,304 |
| 92 | Education officers, school inspectors | 34,294 | -0.6 | 42,163 | 37,046 |
| 93 | Secondary education teaching professionals | 35,166 | 1.5 | 39,220 | 36,125 |
| 94 | Primary and nursery education teaching professionals | 32,217 | 0.2 | 37,110 | 34,839 |
| 95 | Special needs education teaching professionals | 33,877 | 2.8 | 39,691 | 35,182 |
| 96 | Registrars and senior administrators of educational establishments | 31,340 | 0.7 | 35,998 | 32,060 |
| 97 | Teaching professionals n.e.c. | 14,360 | -1.3 | 29,876 | 28,367 |
| 98 | Research Professionals | 30,870 | 0.8 | 32,672 | 30,033 |
| 99 | Scientific researchers | 34,004 | 0.5 | 37,162 | 33,420 |
| 100 | Social science researchers | 23,121 | 2.5 | 23,511 | 21,138 |
| 101 | Researchers n.e.c. | 30,044 | 0.2 | 31,669 | 28,994 |
| 102 | Business and public service professionals | 33,830 | 0.3 | 38,775 | 33,566 |
| 103 | Legal Professionals | 42,251 | -1.5 | 53,651 | 42,019 |
| 104 | Solicitors and lawyers, judges and coroners | 44,552 | 1.2 | 55,813 | 42,848 |
| 105 | Legal professionals n.e.c. | 33,087 | -1.9 | 37,521 | 34,739 |
| 106 | Business And Statistical Professionals | 36,848 | 0.5 | 42,790 | 35,120 |
| 107 | Chartered and certified accountants | 35,569 | 2.1 | 40,813 | 33,943 |
| 108 | Management accountants | 35,851 | -0.7 | 41,093 | 33,770 |
| 109 | Management consultants, actuaries, economists and statisticians | 38,008 | -1.5 | 43,872 | 36,082 |
| 110 | Architects, Town Planners, Surveyors | 35,112 | -2.6 | 36,697 | 31,800 |
| 111 | Architects | 36,375 | -1.5 | 40,383 | |
| 112 | Town planners | 31,755 | -3.9 | 34,250 | 31,128 |
| 113 | Quantity surveyors | 35,575 | -4 | 36,955 | |
| 114 | Chartered surveyors (not quantity surveyors) | 34,757 | -0.7 | 36,463 | |
| 115 | Public Service Professionals | 29,370 | 0.1 | 30,838 | 32,254 |
| 116 | Public service administrative professionals | 49,333 | 5.6 | 54,449 | 44,147 |
| 117 | Social workers | 29,627 | 0.1 | 31,785 | 31,738 |
| 118 | Probation officers | 30,201 | 32,606 | 30,201 | |
| 119 | Clergy | 21,649 | 2.4 | 22,410 | 22,686 |
| 120 | Librarians And Related Professionals | 23,227 | 3.5 | 28,876 | |
| 121 | Librarians | 22,411 | 1.6 | 29,613 | 25,281 |
| 122 | Archivists and curators | 24,665 | 4 | 27,257 | |
| 123 | Associate professional and technical occupations | 26,902 | 0.3 | 31,590 | 27,368 |
| 124 | Science and technology associate professionals | 26,276 | 0 | 28,529 | 23,253 |
| 125 | Science And Engineering Technicians | 25,724 | 1.4 | 28,353 | 20,568 |
| 126 | Laboratory technicians | 19,063 | -4.2 | 24,713 | 19,164 |
| 127 | Electrical/electronics technicians | 29,131 | -0.4 | 29,417 | |
| 128 | Engineering technicians | 32,745 | 3 | 32,973 | 28,326 |
| 129 | Building and civil engineering technicians | 26,219 | 3.5 | 29,436 | 20,979 |
| 130 | Quality assurance technicians | 24,428 | 3.6 | 23,084 | |
| 131 | Science and engineering technicians n.e.c. | 24,417 | 5.4 | 25,516 | 21,487 |
| 132 | Draughtspersons And Building Inspectors | 26,990 | 0 | 28,633 | 25,043 |
| 133 | Architectural technologists and town planning technicians | 25,539 | -3.4 | 27,244 | 25,273 |
| 134 | Draughtspersons | 26,500 | 0.3 | 28,087 | 24,395 |
| 135 | Building inspectors | 29,929 | 3.4 | 29,929 | |
| 136 | IT Service Delivery Occupations | 26,918 | -1 | 28,818 | 26,012 |
| 137 | IT operations technicians | 28,691 | -1.9 | 30,994 | 27,483 |
| 138 | IT user support technicians | 24,923 | 0.3 | 26,895 | 23,829 |
| 139 | Health and social welfare associate professionals | 25,195 | 1.2 | 29,944 | 28,719 |
| 140 | Health Associate Professionals | 26,552 | 0.6 | 33,958 | 30,135 |
| 141 | Nurses | 26,614 | 0.7 | 32,972 | 30,265 |
| 142 | Midwives | 30,190 | 4.8 | 37,234 | 35,189 |
| 143 | Paramedics | 36,703 | 0.2 | 38,491 | 32,838 |
| 144 | Medical radiographers | 32,004 | -1.4 | 38,323 | 36,885 |
| 145 | Chiropodists | 27,482 | -1.5 | 34,322 | 30,642 |
| 146 | Dispensing opticians | ||||
| 147 | Pharmaceutical dispensers | 14,185 | 1.2 | 16,338 | |
| 148 | Medical and dental technicians | 24,246 | 1.4 | 28,850 | 24,989 |
| 149 | Therapists | 25,958 | 2.5 | 30,290 | 30,258 |
| 150 | Physiotherapists | 26,393 | 2.9 | 30,882 | 30,789 |
| 151 | Occupational therapists | 25,491 | 0.8 | 27,643 | 30,220 |
| 152 | Speech and language therapists | 25,012 | -3.7 | 32,245 | |
| 153 | Therapists n.e.c. | 25,308 | 6.1 | 28,583 | 28,150 |
| 154 | Social Welfare Associate Professionals | 21,574 | 0.2 | 25,262 | 23,708 |
| 155 | Youth and community workers | 20,591 | 0.9 | 24,984 | 23,258 |
| 156 | Housing and welfare officers | 22,019 | 0.2 | 25,380 | 23,708 |
| 157 | Protective service occupations | 34,719 | 0.4 | 36,519 | 32,842 |
| 158 | Protective Service Occupations | 34,719 | 0.4 | 36,519 | 32,842 |
| 159 | NCOs and other ranks | ||||
| 160 | Police officers (sergeant and below) | 38,918 | 1.2 | 40,499 | 34,974 |
| 161 | Fire service officers (leading fire officer and below) | 29,736 | 0.1 | 30,789 | 28,652 |
| 162 | Prison service officers (below principal officer) | 26,034 | 2.9 | 28,990 | 22,634 |
| 163 | Protective service associate professionals n.e.c. | 32,585 | 1.3 | 33,542 | 33,184 |
| 164 | Culture, media and sports occupations | 23,248 | 0 | 28,032 | 26,119 |
| 165 | Artistic And Literary Occupations | 26,831 | -2.4 | 31,803 | 31,663 |
| 166 | Artists | 28,445 | 30,454 | ||
| 167 | Authors, writers | 23,447 | -7.3 | 27,889 | 31,425 |
| 168 | Actors, entertainers | ||||
| 169 | Dancers and choreographers | ||||
| 170 | Musicians | 33,415 | |||
| 171 | Arts officers, producers and directors | 31,823 | 3.1 | 32,982 | 35,065 |
| 172 | Design Associate Professionals | 24,447 | 1.6 | 26,024 | 22,918 |
| 173 | Graphic designers | 23,181 | 0.8 | 24,820 | 21,972 |
| 174 | Product, clothing and related designers | 26,625 | -0.3 | 28,044 | 25,100 |
| 175 | Media Associate Professionals | 27,827 | -0.2 | 30,341 | 27,616 |
| 176 | Journalists, newspaper and periodical editors | 28,275 | -1.6 | 30,330 | 27,768 |
| 177 | Broadcasting associate professionals | 39,162 | 2.1 | 39,961 | 43,361 |
| 178 | Public relations officers | 25,835 | 3.2 | 27,794 | |
| 179 | Photographers and audio-visual equipment operators | 23,186 | 4.5 | 27,139 | 19,370 |
| 180 | Sports And Fitness Occupations | 8,362 | -4.4 | 20,173 | 20,211 |
| 181 | Sports players | ||||
| 182 | Sports coaches, instructors and officials | 23,364 | 23,080 | ||
| 183 | Fitness instructors | 16,010 | 17,721 | ||
| 184 | Sports and fitness occupations n.e.c. | ||||
| 185 | Business and public service associate professionals | 26,882 | -0.8 | 32,259 | 24,973 |
| 186 | Transport Associate Professionals | 43,890 | 3.8 | 43,976 | 42,519 |
| 187 | Air traffic controllers | 55,352 | 6.8 | ||
| 188 | Aircraft pilots and flight engineers | 71,555 | 77,717 | ||
| 189 | Ship and hovercraft officers | 36,495 | |||
| 190 | Train drivers | 42,527 | 3.2 | 42,559 | 40,840 |
| 191 | Legal Associate Professionals | 21,925 | -0.3 | 23,018 | |
| 192 | Legal associate professionals | 21,925 | -0.3 | 23,018 | |
| 193 | Business And Finance Associate Professionals | 29,007 | 0 | 34,582 | 27,410 |
| 194 | Estimators, valuers and assessors | 26,562 | 1 | 29,975 | 24,912 |
| 195 | Brokers | 54,924 | 17.3 | ||
| 196 | Insurance underwriters | 28,411 | -0.5 | 31,044 | 28,760 |
| 197 | Finance and investment analysts/advisers | 32,747 | -4.4 | 38,987 | 30,510 |
| 198 | Taxation experts | 30,610 | 5 | 37,078 | 28,883 |
| 199 | Importers, exporters | 20,518 | -1.5 | 22,143 | 19,829 |
| 200 | Financial and accounting technicians | 29,404 | -5.1 | 37,503 | 28,581 |
| 201 | Business and related associate professionals n.e.c. | 25,909 | -1.6 | 30,305 | 25,836 |
| 202 | Sales And Related Associate Professionals | 25,745 | -2.3 | 30,839 | 23,242 |
| 203 | Buyers and purchasing officers | 28,113 | 0.2 | 31,335 | 25,249 |
| 204 | Sales representatives | 25,554 | -3.5 | 30,977 | 21,921 |
| 205 | Marketing associate professionals | 24,986 | -4.3 | 29,931 | 24,233 |
| 206 | Estate agents, auctioneers | 24,420 | |||
| 207 | Conservation Associate Professionals | 26,280 | 5.9 | 26,873 | 26,616 |
| 208 | Conservation and environmental protection officers | 27,431 | 3.8 | 29,059 | 26,916 |
| 209 | Countryside and park rangers | 21,428 | -0.4 | 22,687 | 18,951 |
| 210 | Public Service And Other Associate Professionals | 25,276 | 0.6 | 30,339 | 25,076 |
| 211 | Public service associate professionals | 29,784 | 0.5 | 33,772 | 28,366 |
| 212 | Personnel and industrial relations officers | 22,874 | 0.2 | 26,970 | 23,843 |
| 213 | Vocational and industrial trainers and instructors | 22,534 | -3.6 | 26,307 | 23,118 |
| 214 | Careers advisers and vocational guidance specialists | 24,522 | 0.2 | 26,035 | 26,709 |
| 215 | Inspectors of factories, utilities and trading standards | 32,717 | 0.9 | 35,424 | |
| 216 | Statutory examiners | 25,199 | -2.1 | 26,212 | 28,589 |
| 217 | Occupational hygienists and safety officers (health and safety) | 31,736 | 2.9 | 35,392 | 27,633 |
| 218 | Environmental health officers | 28,616 | -4.9 | 30,147 | 28,470 |
| 219 | Administrative and secretarial occupations | 16,830 | 0.7 | 22,266 | 19,537 |
| 220 | Administrative occupations | 17,357 | 1.2 | 22,330 | 19,499 |
| 221 | Administrative Occupations: Government And Related Organisations | 19,828 | 3 | 23,227 | 20,984 |
| 222 | Civil Service executive officers | 25,794 | 3.3 | 26,438 | 26,074 |
| 223 | Civil Service administrative officers and assistants | 18,426 | 5 | 19,396 | 19,360 |
| 224 | Local government clerical officers and assistants | 20,092 | 1.9 | 24,737 | 21,411 |
| 225 | Officers of non-governmental organisations | 19,569 | 6.5 | 22,491 | |
| 226 | Administrative Occupations: Finance | 18,020 | 1.2 | 23,503 | 20,525 |
| 227 | Credit controllers | 18,502 | 0.7 | 19,333 | 19,708 |
| 228 | Accounts and wages clerks, book-keepers, other financial clerks | 18,326 | 1.8 | 24,406 | 20,684 |
| 229 | Counter clerks | 17,603 | 2 | 22,726 | 20,455 |
| 230 | Administrative Occupations: Records | 18,001 | 3 | 22,406 | 19,045 |
| 231 | Filing and other records assistants/clerks | 17,547 | 0.9 | 22,229 | 19,126 |
| 232 | Pensions and insurance clerks | 19,495 | 2.9 | 23,493 | 19,486 |
| 233 | Stock control clerks | 18,615 | 1.3 | 21,584 | 18,159 |
| 234 | Transport and distribution clerks | 22,281 | 1.6 | 24,896 | 20,079 |
| 235 | Library assistants/clerks | 10,664 | -2.6 | 18,191 | 18,490 |
| 236 | Database assistants/clerks | 16,402 | 2.6 | 20,528 | 17,590 |
| 237 | Market research interviewers | ||||
| 238 | Administrative Occupations: Communications | 20,824 | 1.2 | 27,182 | 23,100 |
| 239 | Telephonists | 14,818 | 5.1 | 19,416 | 19,562 |
| 240 | Communication operators | 24,920 | 0.6 | 27,856 | 25,587 |
| 241 | Administrative Occupations: General | 15,459 | -0.7 | 20,184 | 18,360 |
| 242 | General office assistants/clerks | 15,459 | -0.7 | 20,184 | 18,360 |
| 243 | Secretarial and related occupations | 14,538 | -1 | 20,903 | 19,747 |
| 244 | Secretarial And Related Occupations | 14,538 | -1 | 20,903 | 19,747 |
| 245 | Medical secretaries | 16,692 | 1.8 | 18,145 | 20,408 |
| 246 | Legal secretaries | 17,749 | 4.3 | 19,268 | |
| 247 | School secretaries | 15,091 | -0.6 | 25,721 | 18,167 |
| 248 | Company secretaries | 6,620 | -9 | 22,945 | 23,717 |
| 249 | Personal assistants and other secretaries | 18,580 | 0.6 | 24,145 | 23,364 |
| 250 | Receptionists | 11,548 | 0.3 | 16,788 | 15,962 |
| 251 | Typists | 14,733 | -3.8 | 17,684 | |
| 252 | Skilled trades occupations | 23,097 | 0.7 | 24,429 | 16,799 |
| 253 | Skilled agricultural trades | 17,345 | -1.4 | 18,272 | 15,792 |
| 254 | Agricultural Trades | 17,345 | -1.4 | 18,272 | 15,792 |
| 255 | Farmers | 22,561 | 1.6 | 24,232 | |
| 256 | Horticultural trades | 14,793 | -0.3 | 15,547 | 14,804 |
| 257 | Gardeners and groundsmen/groundswomen | 17,234 | -0.9 | 18,003 | 17,053 |
| 258 | Agricultural and fishing trades n.e.c. | 18,120 | -3.2 | 20,041 | 14,826 |
| 259 | Skilled metal and electrical trades | 26,787 | 2.8 | 27,062 | 23,135 |
| 260 | Metal Forming, Welding And Related Trades | 25,472 | 4.7 | 25,639 | 18,689 |
| 261 | Smiths and forge workers | 25,793 | -5.6 | 25,793 | |
| 262 | Moulders, core makers, die casters | 21,698 | |||
| 263 | Sheet metal workers | 24,632 | 2.2 | 24,882 | |
| 264 | Metal plate workers, shipwrights, riveters | 26,355 | 3.4 | 26,669 | |
| 265 | Welding trades | 24,764 | 6.4 | 25,020 | |
| 266 | Pipe fitters | ||||
| 267 | Metal Machining, Fitting And Instrument Making Trades | 27,593 | 2.5 | 27,761 | 19,504 |
| 268 | Metal machining setters and setter-operators | 25,200 | 5.5 | 25,548 | 14,456 |
| 269 | Tool makers, tool fitters and markers-out | 26,366 | 7.8 | 26,946 | 16,914 |
| 270 | Metal working production and maintenance fitters | 28,180 | 2 | 28,399 | |
| 271 | Precision instrument makers and repairers | 25,902 | -2 | 25,893 | 25,294 |
| 272 | Vehicle Trades | 23,349 | 0.7 | 23,553 | 23,854 |
| 273 | Motor mechanics, auto engineers | 23,280 | -0.5 | 23,508 | 24,807 |
| 274 | Vehicle body builders and repairers | 23,145 | 4.6 | 23,236 | |
| 275 | Auto electricians | 23,485 | 23,984 | ||
| 276 | Vehicle spray painters | 23,997 | 12.2 | 24,009 | |
| 277 | Electrical Trades | 28,488 | 2.9 | 28,856 | 25,196 |
| 278 | Electricians, electrical fitters | 29,390 | 0.4 | 29,554 | |
| 279 | Telecommunications engineers | 29,001 | 8.4 | 29,213 | |
| 280 | Lines repairers and cable jointers | 32,045 | -2.8 | 32,577 | |
| 281 | TV, video and audio engineers | 22,554 | 3.7 | 22,699 | |
| 282 | Computer engineers, installation and maintenance | 27,158 | 8.4 | 27,718 | 26,325 |
| 283 | Electrical/electronics engineers n.e.c. | 26,862 | 2 | 27,163 | 25,053 |
| 284 | Skilled construction and building trades | 22,844 | -1.3 | 23,177 | 21,997 |
| 285 | Construction Trades | 23,361 | -0.4 | 23,713 | 22,055 |
| 286 | Steel erectors | 25,976 | 11.1 | 24,697 | |
| 287 | Bricklayers, masons | 22,393 | -2.6 | 22,452 | |
| 288 | Roofers, roof tilers and slaters | 22,149 | 2.3 | 22,303 | |
| 289 | Plumbers, heating and ventilating engineers | 27,686 | 1.9 | 28,040 | |
| 290 | Carpenters and joiners | 22,818 | -1.2 | 23,075 | 15,058 |
| 291 | Glaziers, window fabricators and fitters | 18,913 | -4.5 | 19,240 | |
| 292 | Construction trades n.e.c. | 23,206 | -0.6 | 23,567 | 23,532 |
| 293 | Building Trades | 21,222 | -3.5 | 21,438 | |
| 294 | Plasterers | 21,327 | -1.4 | 21,347 | |
| 295 | Floorers and wall tilers | 20,076 | -5.4 | 20,078 | |
| 296 | Painters and decorators | 21,516 | -2.9 | 21,901 | |
| 297 | Textiles, printing and other skilled trades | 16,346 | 2.9 | 19,246 | 15,834 |
| 298 | Textiles And Garments Trades | 18,546 | 0.3 | 21,493 | 16,118 |
| 299 | Weavers and knitters | 20,026 | 10 | 20,437 | |
| 300 | Upholsterers | 20,930 | 4.5 | 22,493 | |
| 301 | Leather and related trades | 15,594 | -14.4 | 15,206 | |
| 302 | Tailors and dressmakers | 16,215 | |||
| 303 | Textiles, garments and related trades n.e.c. | 13,807 | |||
| 304 | Printing Trades | 21,843 | 1.3 | 23,335 | 16,627 |
| 305 | Originators, compositors and print preparers | 18,453 | -5 | 19,156 | |
| 306 | Printers | 28,895 | 3.8 | 29,248 | |
| 307 | Bookbinders and print finishers | 18,865 | 0.7 | 21,254 | 16,469 |
| 308 | Screen printers | 18,198 | 17.9 | 18,341 | |
| 309 | Food Preparation Trades | 15,038 | 4.8 | 17,783 | 15,574 |
| 310 | Butchers, meat cutters | 17,330 | 1.8 | 17,588 | |
| 311 | Bakers, flour confectioners | 16,213 | 3.7 | 17,355 | 14,296 |
| 312 | Fishmongers, poultry dressers | 13,117 | 15,483 | 12,799 | |
| 313 | Chefs, cooks | 14,152 | 3.7 | 18,000 | 15,627 |
| 314 | Skilled Trades n. e. c. | 18,855 | 3 | 20,915 | 15,218 |
| 315 | Glass and ceramics makers, decorators and finishers | 18,598 | 0.9 | 20,722 | 17,975 |
| 316 | Furniture makers, other craft woodworkers | 20,006 | 4.3 | 20,496 | |
| 317 | Pattern makers (moulds) | 29,576 | 7.4 | 29,576 | |
| 318 | Musical instrument makers and tuners | ||||
| 319 | Goldsmiths, silversmiths, precious stone workers | ||||
| 320 | Floral arrangers, florists | 13,182 | |||
| 321 | Hand craft occupations n.e.c. | 18,316 | 1 | 19,707 | |
| 322 | Personal service occupations | 12,613 | 0.1 | 19,155 | 16,464 |
| 323 | Caring personal service occupations | 12,516 | 1.2 | 18,303 | 16,543 |
| 324 | Healthcare And Related Personal Services | 13,772 | -0.7 | 18,631 | 17,125 |
| 325 | Nursing auxiliaries and assistants | 15,860 | 1.1 | 20,062 | 18,425 |
| 326 | Ambulance staff (excluding paramedics) | 19,572 | -9.7 | 22,265 | 19,563 |
| 327 | Dental nurses | 14,042 | 0.8 | 16,821 | |
| 328 | Houseparents and residential wardens | 16,383 | -6.9 | 19,492 | 19,279 |
| 329 | Care assistants and home carers | 12,959 | 0.6 | 17,555 | 16,364 |
| 330 | Childcare And Related Personal Services | 10,825 | 2.3 | 16,543 | 15,259 |
| 331 | Nursery nurses | 12,451 | -0.7 | 17,874 | 14,497 |
| 332 | Childminders and related occupations | 11,725 | 2 | 15,454 | |
| 333 | Playgroup leaders/assistants | 5,528 | 2.1 | 11,408 | 12,409 |
| 334 | Educational assistants | 10,869 | 3.2 | 16,547 | 15,791 |
| 335 | Animal Care Services | 13,523 | -5.5 | 14,848 | 15,949 |
| 336 | Veterinary nurses and assistants | 14,690 | 1 | 16,697 | |
| 337 | Animal care occupations n.e.c. | 13,022 | -5.2 | 14,870 | 14,386 |
| 338 | Leisure and other personal service occupations | 13,366 | -3.5 | 20,335 | 15,796 |
| 339 | Leisure And Travel Service Occupations | 15,288 | -4 | 22,546 | 19,900 |
| 340 | Sports and leisure assistants | 10,364 | -9.9 | 16,840 | 16,506 |
| 341 | Travel agents | 16,146 | 10.4 | 19,406 | 17,847 |
| 342 | Travel and tour guides | 6,675 | 6.5 | 16,203 | |
| 343 | Air travel assistants | 21,425 | -4.3 | 30,817 | |
| 344 | Rail travel assistants | 28,140 | 7.3 | 29,745 | 25,595 |
| 345 | Leisure and travel service occupations n.e.c. | 18,153 | |||
| 346 | Hairdressers And Related Occupations | 9,980 | -5.7 | 16,044 | 12,514 |
| 347 | Hairdressers, barbers | 9,599 | -4.5 | 15,675 | 11,829 |
| 348 | Beauticians and related occupations | 11,732 | -5.9 | 14,825 | |
| 349 | Housekeeping Occupations | 14,075 | -0.8 | 19,012 | 14,692 |
| 350 | Housekeepers and related occupations | 11,040 | -0.9 | 16,040 | 14,300 |
| 351 | Caretakers | 16,377 | -3.9 | 19,126 | 17,112 |
| 352 | Personal Services Occupations n. e. c. | 19,619 | 8.3 | 20,739 | 21,212 |
| 353 | Undertakers and mortuary assistants | 21,194 | 21,212 | ||
| 354 | Pest control officers | 20,000 | 4.5 | 20,000 | |
| 355 | Sales and customer service occupations | 10,041 | 3.1 | 16,815 | 15,052 |
| 356 | Sales occupations | 9,124 | 5.8 | 16,200 | 13,884 |
| 357 | Sales Assistants And Retail Cashiers | 8,844 | 5.4 | 15,835 | 13,639 |
| 358 | Sales and retail assistants | 8,736 | 5.4 | 15,842 | 13,577 |
| 359 | Retail cashiers and check-out operators | 8,481 | 6.2 | 14,027 | 13,048 |
| 360 | Telephone salespersons | 17,405 | -0.6 | 19,716 | 18,560 |
| 361 | Sales Related Occupations | 16,446 | 4.6 | 19,646 | 17,954 |
| 362 | Collector salespersons and credit agents | 17,193 | -13.8 | 17,148 | 17,422 |
| 363 | Debt, rent and other cash collectors | 15,665 | 3.4 | 18,080 | 15,705 |
| 364 | Roundsmen/women and van salespersons | 19,466 | -6 | 21,642 | |
| 365 | Market and street traders and assistants | 19,803 | |||
| 366 | Merchandisers and window dressers | 13,858 | 11 | 20,352 | 20,197 |
| 367 | Sales related occupations n.e.c. | 16,995 | 4.7 | 21,302 | 18,215 |
| 368 | Customer service occupations | 14,741 | -1.7 | 18,256 | 17,543 |
| 369 | Customer Service Occupations | 14,741 | -1.7 | 18,256 | 17,543 |
| 370 | Call centre agents/operators | 15,029 | -0.2 | 16,419 | |
| 371 | Customer care occupations | 14,689 | -1.8 | 18,576 | 17,726 |
| 372 | Process, plant and machine operatives | 21,001 | 0.7 | 22,838 | 16,142 |
| 373 | Process, plant and machine operatives | 20,795 | 2.2 | 23,099 | 15,951 |
| 374 | Process Operatives | 18,974 | -0.4 | 20,912 | 15,529 |
| 375 | Food, drink and tobacco process operatives | 16,875 | -0.2 | 18,914 | 15,386 |
| 376 | Glass and ceramics process operatives | 20,819 | 4.1 | 21,782 | |
| 377 | Textile process operatives | 18,237 | 3 | 20,466 | 13,533 |
| 378 | Chemical and related process operatives | 24,408 | -3.9 | 25,688 | 18,367 |
| 379 | Rubber process operatives | 24,048 | 13.8 | 24,198 | |
| 380 | Plastics process operatives | 20,336 | 7.2 | 20,436 | 16,765 |
| 381 | Metal making and treating process operatives | 25,574 | 5.2 | 26,557 | 12,916 |
| 382 | Electroplaters | 19,424 | -1.7 | 19,080 | |
| 383 | Process operatives n.e.c. | 25,772 | 6.5 | 26,635 | 15,582 |
| 384 | Plant And Machine Operatives | 23,077 | 5.3 | 23,891 | 15,200 |
| 385 | Paper and wood machine operatives | 21,036 | 4.4 | 21,556 | |
| 386 | Coal mine operatives | 41,140 | 2.2 | 38,489 | |
| 387 | Quarry workers and related operatives | 26,732 | 6.8 | 27,060 | |
| 388 | Energy plant operatives | 26,998 | -10.6 | 30,558 | 19,128 |
| 389 | Metal working machine operatives | 21,946 | 4.4 | 23,240 | 14,716 |
| 390 | Water and sewerage plant operatives | 27,959 | 4.3 | 28,108 | |
| 391 | Plant and machine operatives n.e.c. | 21,606 | 5.5 | 22,766 | 16,318 |
| 392 | Assemblers And Routine Operatives | 18,703 | 3 | 21,701 | 16,127 |
| 393 | Assemblers (electrical products) | 17,370 | 7.5 | 19,392 | 16,475 |
| 394 | Assemblers (vehicles and metal goods) | 27,108 | 14.7 | 27,648 | 18,008 |
| 395 | Routine inspectors and testers | 21,431 | 3.1 | 23,597 | 17,523 |
| 396 | Weighers, graders, sorters | 21,747 | 14,544 | ||
| 397 | Tyre, exhaust and windscreen fitters | 18,512 | -0.6 | 18,856 | |
| 398 | Clothing cutters | 14,550 | |||
| 399 | Sewing machinists | 13,161 | 5.4 | 15,984 | 14,366 |
| 400 | Routine laboratory testers | 15,203 | -4 | 15,478 | |
| 401 | Assemblers and routine operatives n.e.c. | 17,437 | 3.5 | 19,085 | 16,402 |
| 402 | Construction Operatives | 26,791 | 2 | 27,566 | |
| 403 | Scaffolders, stagers, riggers | 29,850 | 2.8 | 29,441 | |
| 404 | Road construction operatives | 24,768 | 0.6 | 24,996 | |
| 405 | Rail construction and maintenance operatives | 30,654 | 5 | 31,032 | |
| 406 | Construction operatives n.e.c. | 25,633 | -1.7 | 27,201 | 18,874 |
| 407 | Transport and mobile machine drivers and operatives | 21,238 | -0.4 | 22,640 | 17,984 |
| 408 | Transport Drivers And Operatives | 21,102 | -0.6 | 22,552 | 18,098 |
| 409 | Heavy goods vehicle drivers | 25,196 | 2 | 25,579 | |
| 410 | Van drivers | 17,069 | -2.2 | 18,959 | 15,140 |
| 411 | Bus and coach drivers | 21,563 | 1.8 | 22,232 | 21,660 |
| 412 | Taxi, cab drivers and chauffeurs | 13,476 | -0.1 | 19,270 | 13,374 |
| 413 | Driving instructors | 24,417 | -1.2 | 24,857 | |
| 414 | Rail transport operatives | 33,478 | 7.1 | 33,830 | 31,024 |
| 415 | Seafarers (merchant navy); barge, lighter and boat operatives | 29,413 | 5.4 | 29,239 | |
| 416 | Air transport operatives | 23,513 | -2.5 | 24,204 | |
| 417 | Transport operatives n.e.c. | 24,175 | -0.2 | 25,754 | 13,098 |
| 418 | Mobile Machine Drivers And Operatives | 22,878 | 2.3 | 23,244 | 16,811 |
| 419 | Crane drivers | 30,575 | 32,179 | ||
| 420 | Fork-lift truck drivers | 18,995 | -0.4 | 19,144 | |
| 421 | Agricultural machinery drivers | 23,937 | 13.5 | 23,846 | |
| 422 | Mobile machine drivers and operatives n.e.c. | 25,009 | 1.9 | 25,028 | |
| 423 | Elementary occupations | 11,954 | -0.9 | 18,462 | 14,135 |
| 424 | Elementary trades, plant and storage related occupations | 17,159 | 0.7 | 18,663 | 15,465 |
| 425 | Elementary Agricultural Occupations | 16,692 | 2.4 | 18,945 | 14,208 |
| 426 | Farm workers | 17,571 | 3.1 | 19,793 | 14,715 |
| 427 | Forestry workers | 21,454 | 11.5 | 22,519 | |
| 428 | Fishing and agriculture related occupations n.e.c. | 13,895 | -3.1 | 16,475 | 13,564 |
| 429 | Elementary Construction Occupations | 18,667 | 2.2 | 19,587 | 18,490 |
| 430 | Labourers in building and woodworking trades | 18,733 | 2.2 | 19,688 | |
| 431 | Labourers in other construction trades n.e.c. | 18,601 | 3.4 | 19,382 | 18,490 |
| 432 | Elementary Process Plant Occupations | 16,375 | -0.5 | 17,939 | 15,077 |
| 433 | Labourers in foundries | 18,405 | 5 | 18,435 | |
| 434 | Industrial cleaning process occupations | 17,128 | 1.5 | 17,970 | 17,032 |
| 435 | Printing machine minders and assistants | 20,151 | 1.2 | 22,248 | 17,777 |
| 436 | Packers, bottlers, canners, fillers | 15,242 | 1.1 | 16,735 | 15,037 |
| 437 | Labourers in process and plant operations n.e.c. | 16,714 | -1.9 | 17,774 | 14,712 |
| 438 | Elementary Goods Storage Occupations | 17,328 | 0.9 | 18,723 | 15,764 |
| 439 | Stevedores, dockers and slingers | 24,931 | 3.6 | 25,522 | |
| 440 | Other goods handling and storage occupations n.e.c. | 17,275 | 1 | 18,650 | 15,764 |
| 441 | Elementary administration and service occupations | 8,333 | -0.9 | 18,093 | 13,606 |
| 442 | Elementary Administration Occupations | 20,355 | 1.3 | 23,301 | 18,107 |
| 443 | Postal workers, mail sorters, messengers, couriers | 21,457 | 2.9 | 23,793 | 21,459 |
| 444 | Elementary office occupations n.e.c. | 10,907 | 7.1 | 16,184 | 14,176 |
| 445 | Elementary Personal Services Occupations | 7,025 | -3.2 | 12,973 | 12,331 |
| 446 | Hospital porters | 18,619 | 6.6 | 19,157 | 15,703 |
| 447 | Hotel porters | 14,515 | |||
| 448 | Kitchen and catering assistants | 7,870 | 2 | 12,428 | 12,412 |
| 449 | Waiters, waitresses | 5,660 | -11.2 | 12,619 | 11,894 |
| 450 | Bar staff | 6,058 | 0.2 | 12,604 | 12,071 |
| 451 | Leisure and theme park attendants | 13,494 | 11,836 | ||
| 452 | Elementary personal services occupations n.e.c. | 11,198 | 14,315 | ||
| 453 | Elementary Cleaning Occupations | 6,978 | -4 | 16,076 | 13,353 |
| 454 | Window cleaners | 15,972 | 16,431 | ||
| 455 | Road sweepers | 17,396 | 0.1 | 17,503 | |
| 456 | Cleaners, domestics | 6,502 | -3.4 | 15,162 | 13,290 |
| 457 | Launderers, dry cleaners, pressers | 11,500 | 3.7 | 13,603 | 12,847 |
| 458 | Refuse and salvage occupations | 17,973 | -0.4 | 18,243 | 17,640 |
| 459 | Elementary cleaning occupations n.e.c. | 14,218 | |||
| 460 | Elementary Security Occupations | 12,120 | 6.4 | 20,739 | 22,220 |
| 461 | Security guards and related occupations | 20,339 | 0.2 | 21,160 | 23,754 |
| 462 | Traffic wardens | 17,750 | -11 | 17,703 | |
| 463 | School crossing patrol attendants | 3,625 | 0.9 | 18,904 | |
| 464 | School mid-day assistants | 2,189 | 0.7 | ||
| 465 | Car park attendants | 17,297 | 17,685 | 20,101 | |
| 466 | Elementary security occupations n.e.c. | 19,092 | 15,799 | ||
| 467 | Elementary Sales Occupations | 9,945 | 4.9 | 14,446 | 13,908 |
| 468 | Shelf fillers | 9,946 | 4.9 | 14,601 | 13,901 |
| 469 | Elementary sales occupations n.e.c. | 13,244 | 15,278 | ||
| 470 | Not Classified | ||||
Download the data
• DATA: download the full datasheet
More open data
Data journalism and data visualisations from the Guardian
World government data
• Search the world's government data with our gateway
Development and aid data
• Search the world's global development data with our gateway
Can you do something with this data?
• Flickr Please post your visualisations and mash-ups on our Flickr group
• Contact us at data@guardian.co.uk
• Get the A-Z of data
• More at the Datastore directory
• Follow us on Twitter
• Like us on Facebook