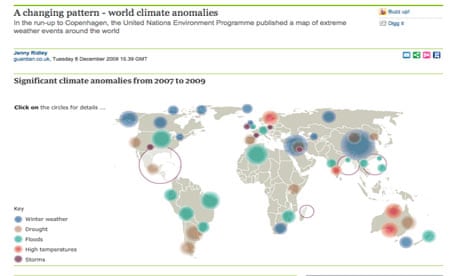
In the run-up to Copenhagen, the United Nations Environment Programme (UNEP) published its Climate Change Science Compendium, a summary of 400 peer-reviewed research papers published since 2006.
To illustrate some of the extreme weather events – which appear to be happening with increasing frequency over the past couple of years – it published a map based on data from the National Oceanic and Atmospheric Adminstration (2007-09). We've added two notable recent events from this year – theCumbria floods and flooding in Bangladesh.
The compendium also cites research published last year which identified nine "tipping elements" in the earth's weather systems that are considered vulnerable to possible abrupt and irreversible change.
The tipping points
1) Indian summer monsoon: The regional atmospheric brown cloud is one of the many climate change-related factors that could disrupt the monsoon.
2) Sahara and West African monsoon: Small changes to the monsoon have triggered abrupt wetting and drying of the Sahara in the past. Some models suggest an abrupt return to wet times. 3) Arctic summer sea-ice: As sea-ice melts, it exposes darker ocean, which absorbs more heat than ice does, causing further warming. 4) Amazon rainforest: Losing critical mass of the rainforest is likely to reduce internal hydrological cycling, triggering further dieback. 5) Boreal forests: Longer growing seasons and dry periods increase vulnerability to fires and pests. 6) Atlantic Ocean thermohaline circulation: Regional ice melt will freshen North Atlantic water. This could shut down the ocean circulation system, including the Gulf Stream, which is driven by the sinking of dense saline water in this region. 7) El Niño Southern Oscillation (ENSO): El Niño already switches on and off regularly. Climate change models suggest ENSO will enter a near-permanent switch-on. 8) Greenland ice-sheet: As ice melts, the height of surface ice decreases, so the surface is exposed to warmer temperatures at lower altitudes which accelerates melting that could lead to ice-sheet break up. 9) West Antarctic ice-sheet: The ice-sheets are frozen to submarine mountains, so there is high potential for sudden release and collapse as oceans warm.
(Source: Lenton et al. 2008)
The predicted timescales for these tipping points vary from between one year and 300 years, and the temperature rises vary between 0.2C to 5C.
But the Guardian's version of Unep's map shows extreme weather events – from Atlantic hurricanes to Australian droughts – are happening not just with greater frequency, but greater violence.

Comments (…)
Sign in or create your Guardian account to join the discussion