=======================================
Oracle Performance Dashboard (OPD) is a small ASP.NET website that shows you performance & problems of one or more Oracle instances in near real-time. It uses the Dynamic Performance Views (DPV) and runs some popular DBA scripts in order to get meaningful, easy to understand information out of the server. You can use it to quickly spot blocking queries, who is blocking who, expensive query that are consuming high CPU or disk, see if there's unusual locks, very high disk activity and so on.

The binaries are here, which you can just extract into an IIS folder, put the connection strings in the web.config file, and you are ready to roll. No need to install any Oracle client software on the server.
GitHub Project Binaries
You can get the source code from the GitHub project site: https://github.com/oazabir/OraclePerformanceDashboard
You can see a live demo of this here: http://odp.omaralzabir.com
OEM is pretty good, no doubt. But what I need is something that runs complex DBA scripts, processes the output and tells me what is wrong exactly. On standard monitoring tools like OEM, you get to see the key performance indicators and sometimes some generic alerts, but a much more powerful way to investigate problems in the server is to run those DBA scripts that you find in Oracle Performance Tuning books and blogs, that really get into the heart of the problem and shows you where things are going wrong. There are many powerful scripts available on the books, forums, blogs that are quite handy to detect issues on the server, gather relevant useful information about your database health. This tool tries to give those powerful scripts a nice front-end and easy to discover clues for those, who aren't professional Oracle DBAs like me.
OPD comes with the following features in V1:
- Overview of all your instances in one screen, showing important indicators on each instance.
- CPU usage on the OS
- CPU consumed by each session
- Important System Statistics like Buffer Gets, Parse to execute ratio which would indicate some common problems on the server.
- Sessions and what the sessions are doing, how much resource they are consuming, whether they are hogging the disk or not.
- Waits, Blocks, Locks, deadlocks that make database suffer.
- Historical analysis on the databse showing you some very useful stuff:
- Most expensive queries in terms of CPU and Buffer Get, which are immediate convern for your devs to sort out.
- IO usage on data files. You can see if some data file is unusually loaded and getting hammered by physical IO.
- Tablespace usage. Alerts you if some tablespace is over 85% full.
- Stale stats on tables. You should always keep this clean.
- Killer Indexes that will actually blow up your system and confuse Oracle query optimizer. You need to get rid of those indexes and rewrite queries that you thought will hit those indexes for better performance. They won't. They will kill your database.
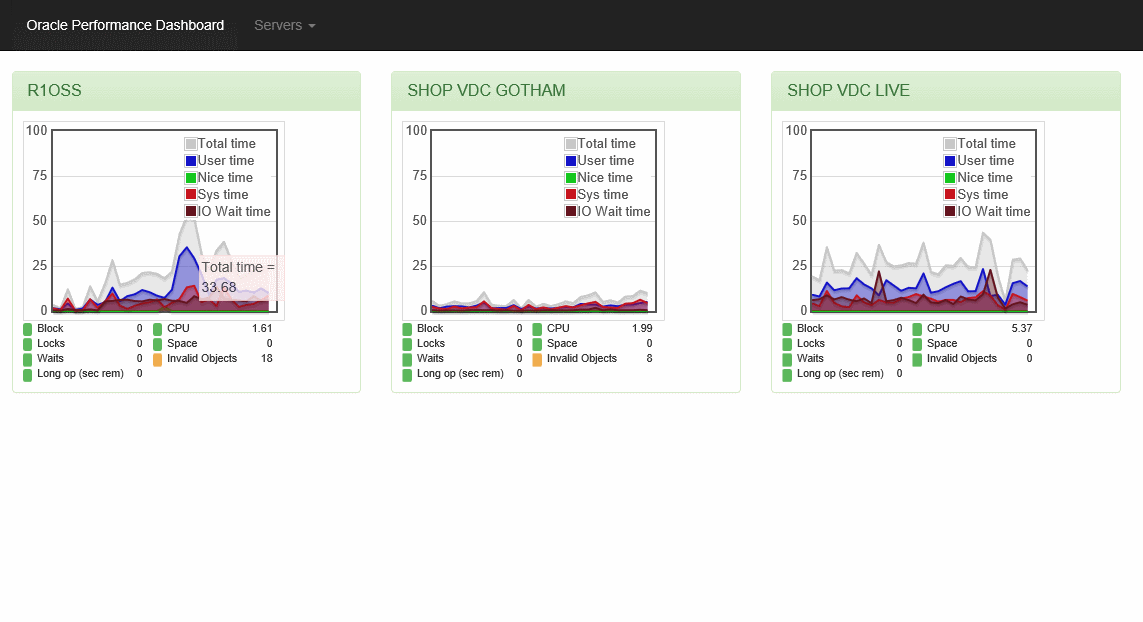
When you launch OPD, you see a quick summary of all your instances and indicators showing you whether there's something off in any of the instances. You can then click on the instance name and zoom into more details on each instance.
When you zoom into an instance, you get the Dashboard for that instance.
The dashboard shows you the resource usage on the instance and some key system statistics.

On the left, it shows the CPU usage on the OS and shows you how much CPU is used by user, sys, IO. Usually when there's a IO bottleneck, you will see the IO line goes up.
On the right, it shows the CPU consumed by each session. If some session is off the chart, you know that session is the culprit.
At the bottom, there are 4 key indicators. They will be red if they aren't optimal or at least what the best practice guideline says they should be. For example, Buffer Cache hit Ratio should be over 95%. You can see on the graph that sometimes it becomes green, because sometimes it is over 95%.
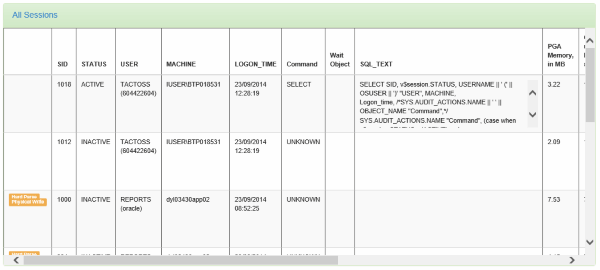
This shows details about the ACTIVE sessions. You can see if there's any session consuming high CPU, high physical read, hard parse and so on. The yellow warning indicator will come up if there's something off.
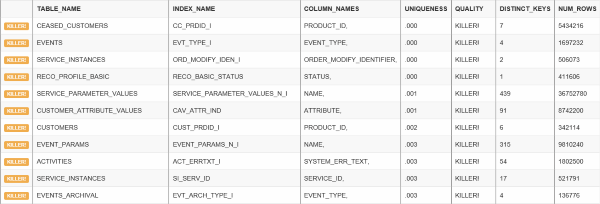
This is very handy for developers because you can quickly see which indexes are bad by design, because you have columns in the index which have very low selectivity. For example, on the screenshot, you can see there are some killer index. Trying to use those indexes will actually kill your server. You can see the first example that there are just 7 unique values on column PRODUCT_ID, but there are over 5 million rows. So, each PRODUCT_ID has probably got over 1 million rows against it. Some developer thought that there's a query that has WHERE PRODUCT_ID=X and thus created the index on PRODUCT_ID. But it is not going to work in this case. Sometimes during development and testing, we do not have representative data from production database and thus we do not catch such issues. Only when we go-live and go down the next hour, we realize what we have done wrong. This view of Bad Indexes will help identify such wrong index designs.
Locks and waits are common culprits causing performance degradation on the servers. You can quickly see from this tool what locks are being held, and what are the expensive waits.
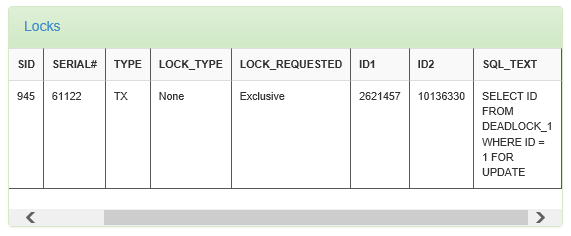
It will show you the exact query holding lock and causing contention or even deadlocks. Here you see that session ID1 and ID2 grabbing exclusive lock and getting into a deadlock.
You will notice that the panels are refreshing periodically. You might think I am using AJAX to call some serverside web service in order to get JSON/XML response, and then use some jQuery template to render the html output. Nope. I am using what our ancestors have happily used for generations. The natural, organic IFRAME solution, with no side effect. The html output for each panel comes from individual ASP.NET pages, via IFRAMEs and then they get injected into a DIV on the main Dashboard page.
There are several benefits to this approach:
- The widgets are individual pages, which user can browse directly in full browser view.
- Each widget is a plain ASP.NET page. No need to build webservices to return data in JSON/XML format. No need for any entity classes either that you usually use to serialize into JSON/XML.
- The HTML content is generated server side, using regular ASP.NET. Thus there's no need to use any Javascript based HTML templating library.
- As there's no need for AJAX or html templating, there's no need to worry about jQuery or its plugin breaking compatibility in new versions, and updating javascript libraries regularly.
Let's see how to do this. First the HTML markup to draw the panels:
<div class="row">
	<div class="panel panel-success">
		<div class="panel-heading"><a href="WhoIsActive.aspx?c=<%= ConnectionString %>">What's going on</a></div>
		<div class="panel-body panel-body-height" id="WhoIsActive">
			<div class="progress">
				<div class="progress-bar progress-bar-striped" style="width: 60%"><span class="sr-only">100% Complete</span></div>
			</div>
		</div>
		<iframe class="content_loader" onload="setContent(this, 'WhoIsActive')" src="WhoIsActive.aspx?c=<%= ConnectionString %>" style="width: 100%; height: 100%; border: none; display: none" frameborder="0"></iframe>
	</div>
</div>
This is the markup taken from the Twitter Bootstrap theme.
You will notice there's an invisible IFRAME there. When the IFRAME loads, it calls the setContent function. That function takes the whole content of the IFRAME and injects inside the panel-body div.
function setContent(iframe, id) {
    ...
    $('#' + id)
        .html($(iframe).contents().find("form").html())
        .dblclick(function () {
            iframe.contentWindow.location.reload();
        })
        ...
}
There you go, clean AJAX-like solution without any AJAX: no XMLHTTP, no JSON plumbing, no HTML templating, no server-side webservice.
Now this would not work for any event handler that is hooked inside the IFRAME. So, how does the click on a query show the popup window with the full query? Also if it was an IFRAME, shouldn't the popup actually come inside the IFRAME?
The click functionality is done on the main Dashboard page. After injecting the content into the DIV, it hooks the click handlers that shows the popup on the main page:
function setContent(iframe, id) {
    $('#' + id)
        .find('td.large-cell').off('click');

    if ($('#' + id).scrollLeft() == 0) {
        $('#' + id)
            .html($(iframe).contents().find("form").html())
            .dblclick(function () {
                iframe.contentWindow.location.reload();
            })
            .find('td.large-cell').find('div').click(function () {
                $('#content_text').text($(this).html());
                $('#basic-modal-content').modal();
            });
    }
Here's it looks for any <TD> having the class large-cell. It then hooks the click even on it and shows the modal dialog box. The modal dialog box is from Eric Martin's SimpleModal plugin.
The chart uses the jQuery plugin Flot to render some of the performance counters as running charts.
There's a SysStats.aspx which is responsible for rendering the table showing the performance counters. It picks some important counters, and marks them to appear on the chart. First it runs through the table, looking for the counters, and marks the label of the counter as x-axis and value of the counter as y-axis:
var plot = ["Buffer cache hit ratio (95+)", "Parse CPU to total CPU ratio (<30)", "Shared pool free (~0)", "Parse to execute ratio (<0.3)"];
$('td').each(function (i, e) {
    td = $(e);
    if (td.text().trim().length > 0) {
        for (var i = 0; i < plot.length; i ++) {
            if (plot[i] == td.text().trim()) {
                td.addClass("x-axis");
                td.next().addClass("y-axis");
            }
        }
    }
})
Now this page is hosted on the Dashboard page inside an IFRAME. So, the Dashboard page scans the IFRAME content, looks for these labels, picks their values and passes to the Flot chart plugin:
$(iframe).contents().find("form").find(".x-axis").each(function (i, e) {
    var x = $(e);
    var y = x.next('.y-axis');
    var xname = x.text();
    var yvalue = parseInt(y.text());
    if (datasets[xname]) {
        var data = datasets[xname].data;
        data.pop();
        data.splice(0, 0, yvalue);
    }## Heading ##
});
Rest of the job of updating the Flot chart is done by the usual Flot code:
function updatePlot() {
    var index = 0;

    $.each(datasets, function (key, val) {
        var items = [];
        for (var i = 0; i < val.data.length; i++)
            items.push([i, val.data[i]]);

        var data = { color: val.color, data: items };

        if (plots[index] != null) {
            plot = plots[index];
            plot.setData([data]);
            plot.draw();
        }
        else {
            plot = $.plot("#placeholder" + (index + 1), [data], {
                series: {
                    //shadowSize: 0	// Drawing is faster without shadows
                },
                lines: { show: true, fill: true },
                grid: {
                    hoverable: true,
                    clickable: true
                },
                yaxis: {
                    min: 0,
                    max: val.ymax
                },
                xaxis: {
                    show: false
                }
            });
That's it! Again, no AJAX, no webservice, no html templating, no JSON plubing. Pure organic IFRAME and html.
OPD tries to make it easy for us to monitor Oracle instance health. It gives meaningful information out of the verbose data produced by Oracle's built-in views. It shows you exactly where the problem is. You can customize the code anyway you like, adding your own warnings, own thresholds, and adjust it to suit your specific need.